|
||
|
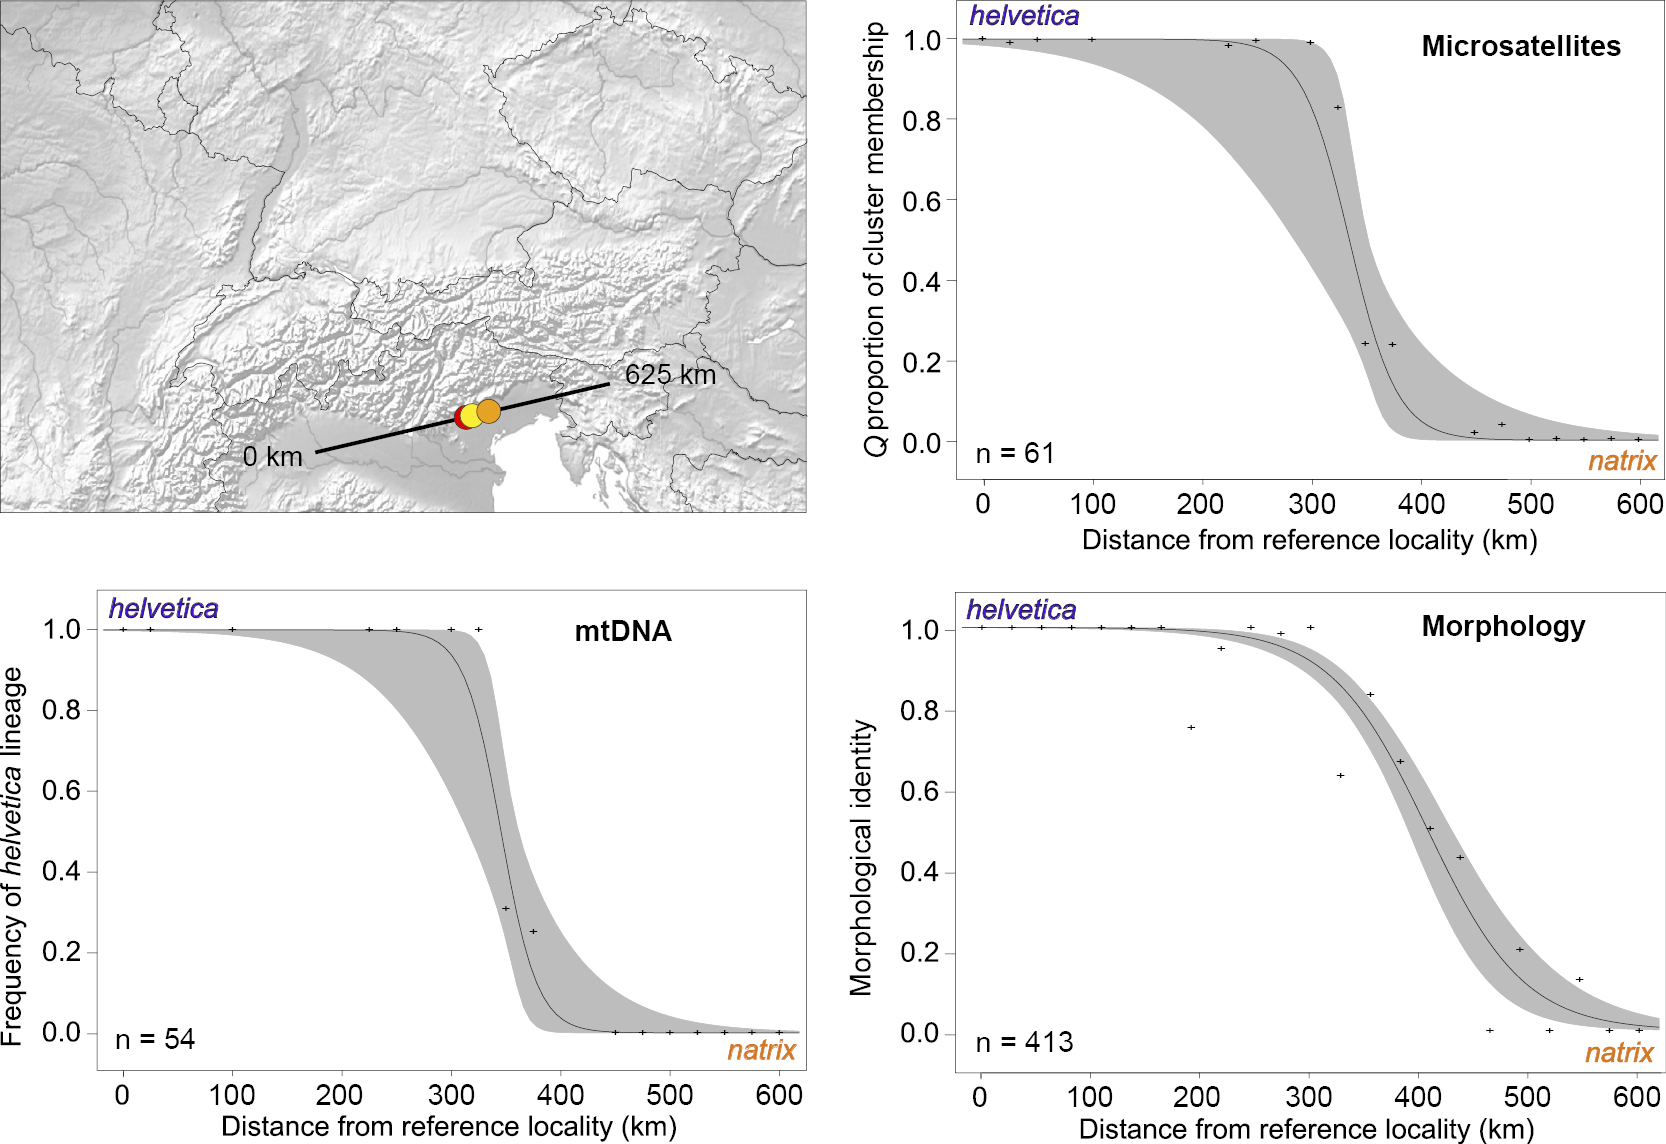
Cline analyses for microsatellite data, mitochondrial DNA, and morphology for the Italian contact zone of Natrix helvetica and N. natrix. Map: cline centers for microsatellites in red, for mtDNA in yellow, and for morphology in orange. Other diagrams: Maximum Likelihood clines for microsatellites (Q values of cluster membership), mtDNA identity, and morphological identity; fuzzy cline regions (95% credibility intervals) in grey. Clines for mtDNA and microsatellites redrawn from Schultze et al. (2020). |