|
||
|
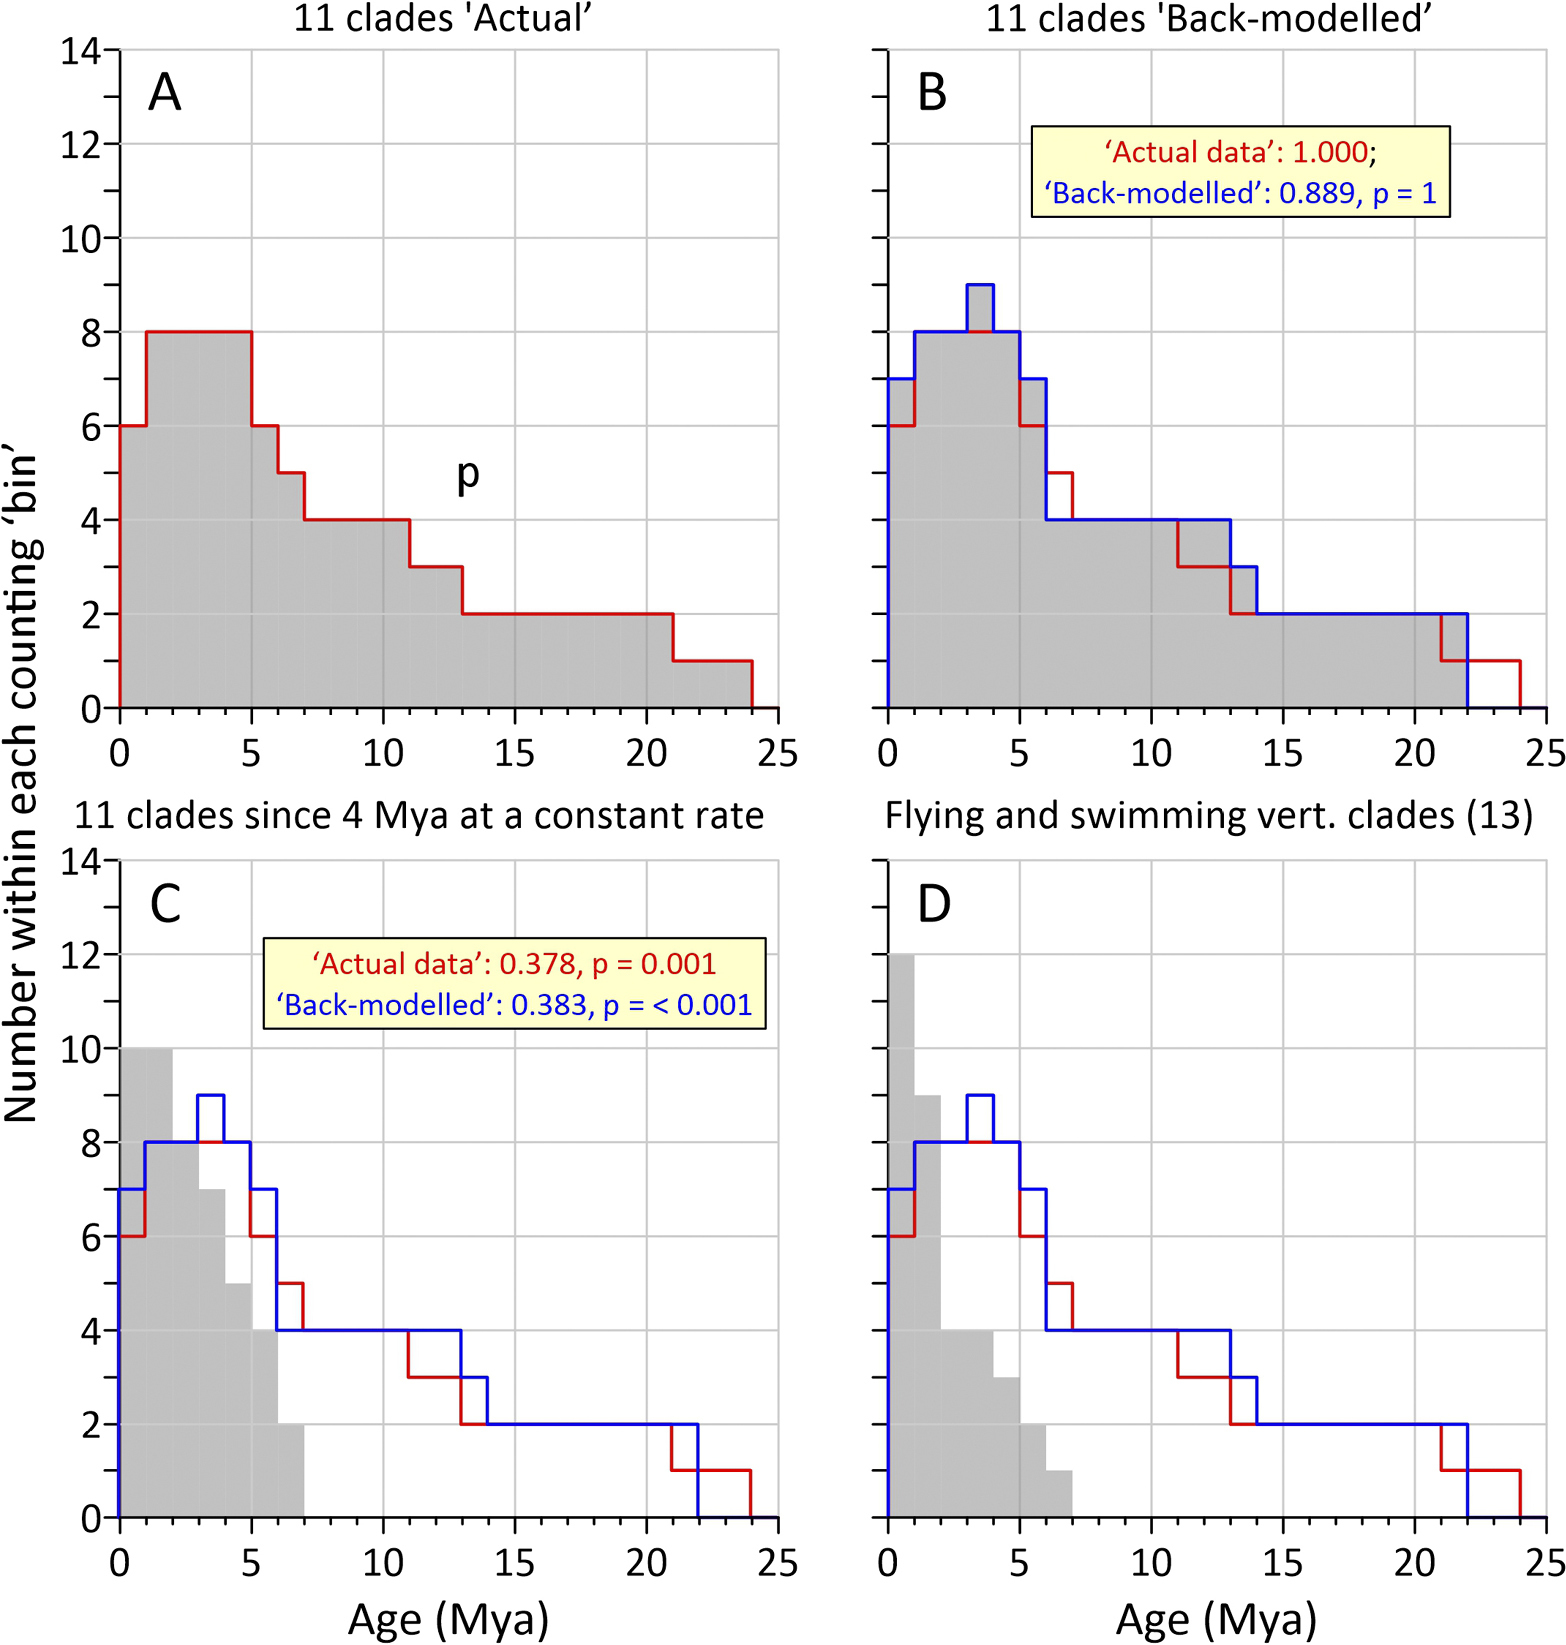
Galápagos vertebrate colonization profiles. (A) is the ‘actual’ data (grey shaded region and red line) for the land vertebrates, while (B) is the ‘back-modelled’ data (grey shaded region and blue line, with the ‘actual’ data line [red] overlain). (C) is a simulation based upon all of the colonizations taking since the oldest extant island (San Cristóbal) formed, with an arrival every c. 381 kya starting at 4 Mya and ending at c. 190 kya, a scenario that is termed ‘constant rate’. (D) is the profile for the non-land vertebrate clades, with the ‘actual’ and ‘back-modelled’ land-vertebrate lines added. Where appropriate, ‘fit’ and p values are shown on the respective plots. |