|
||
|
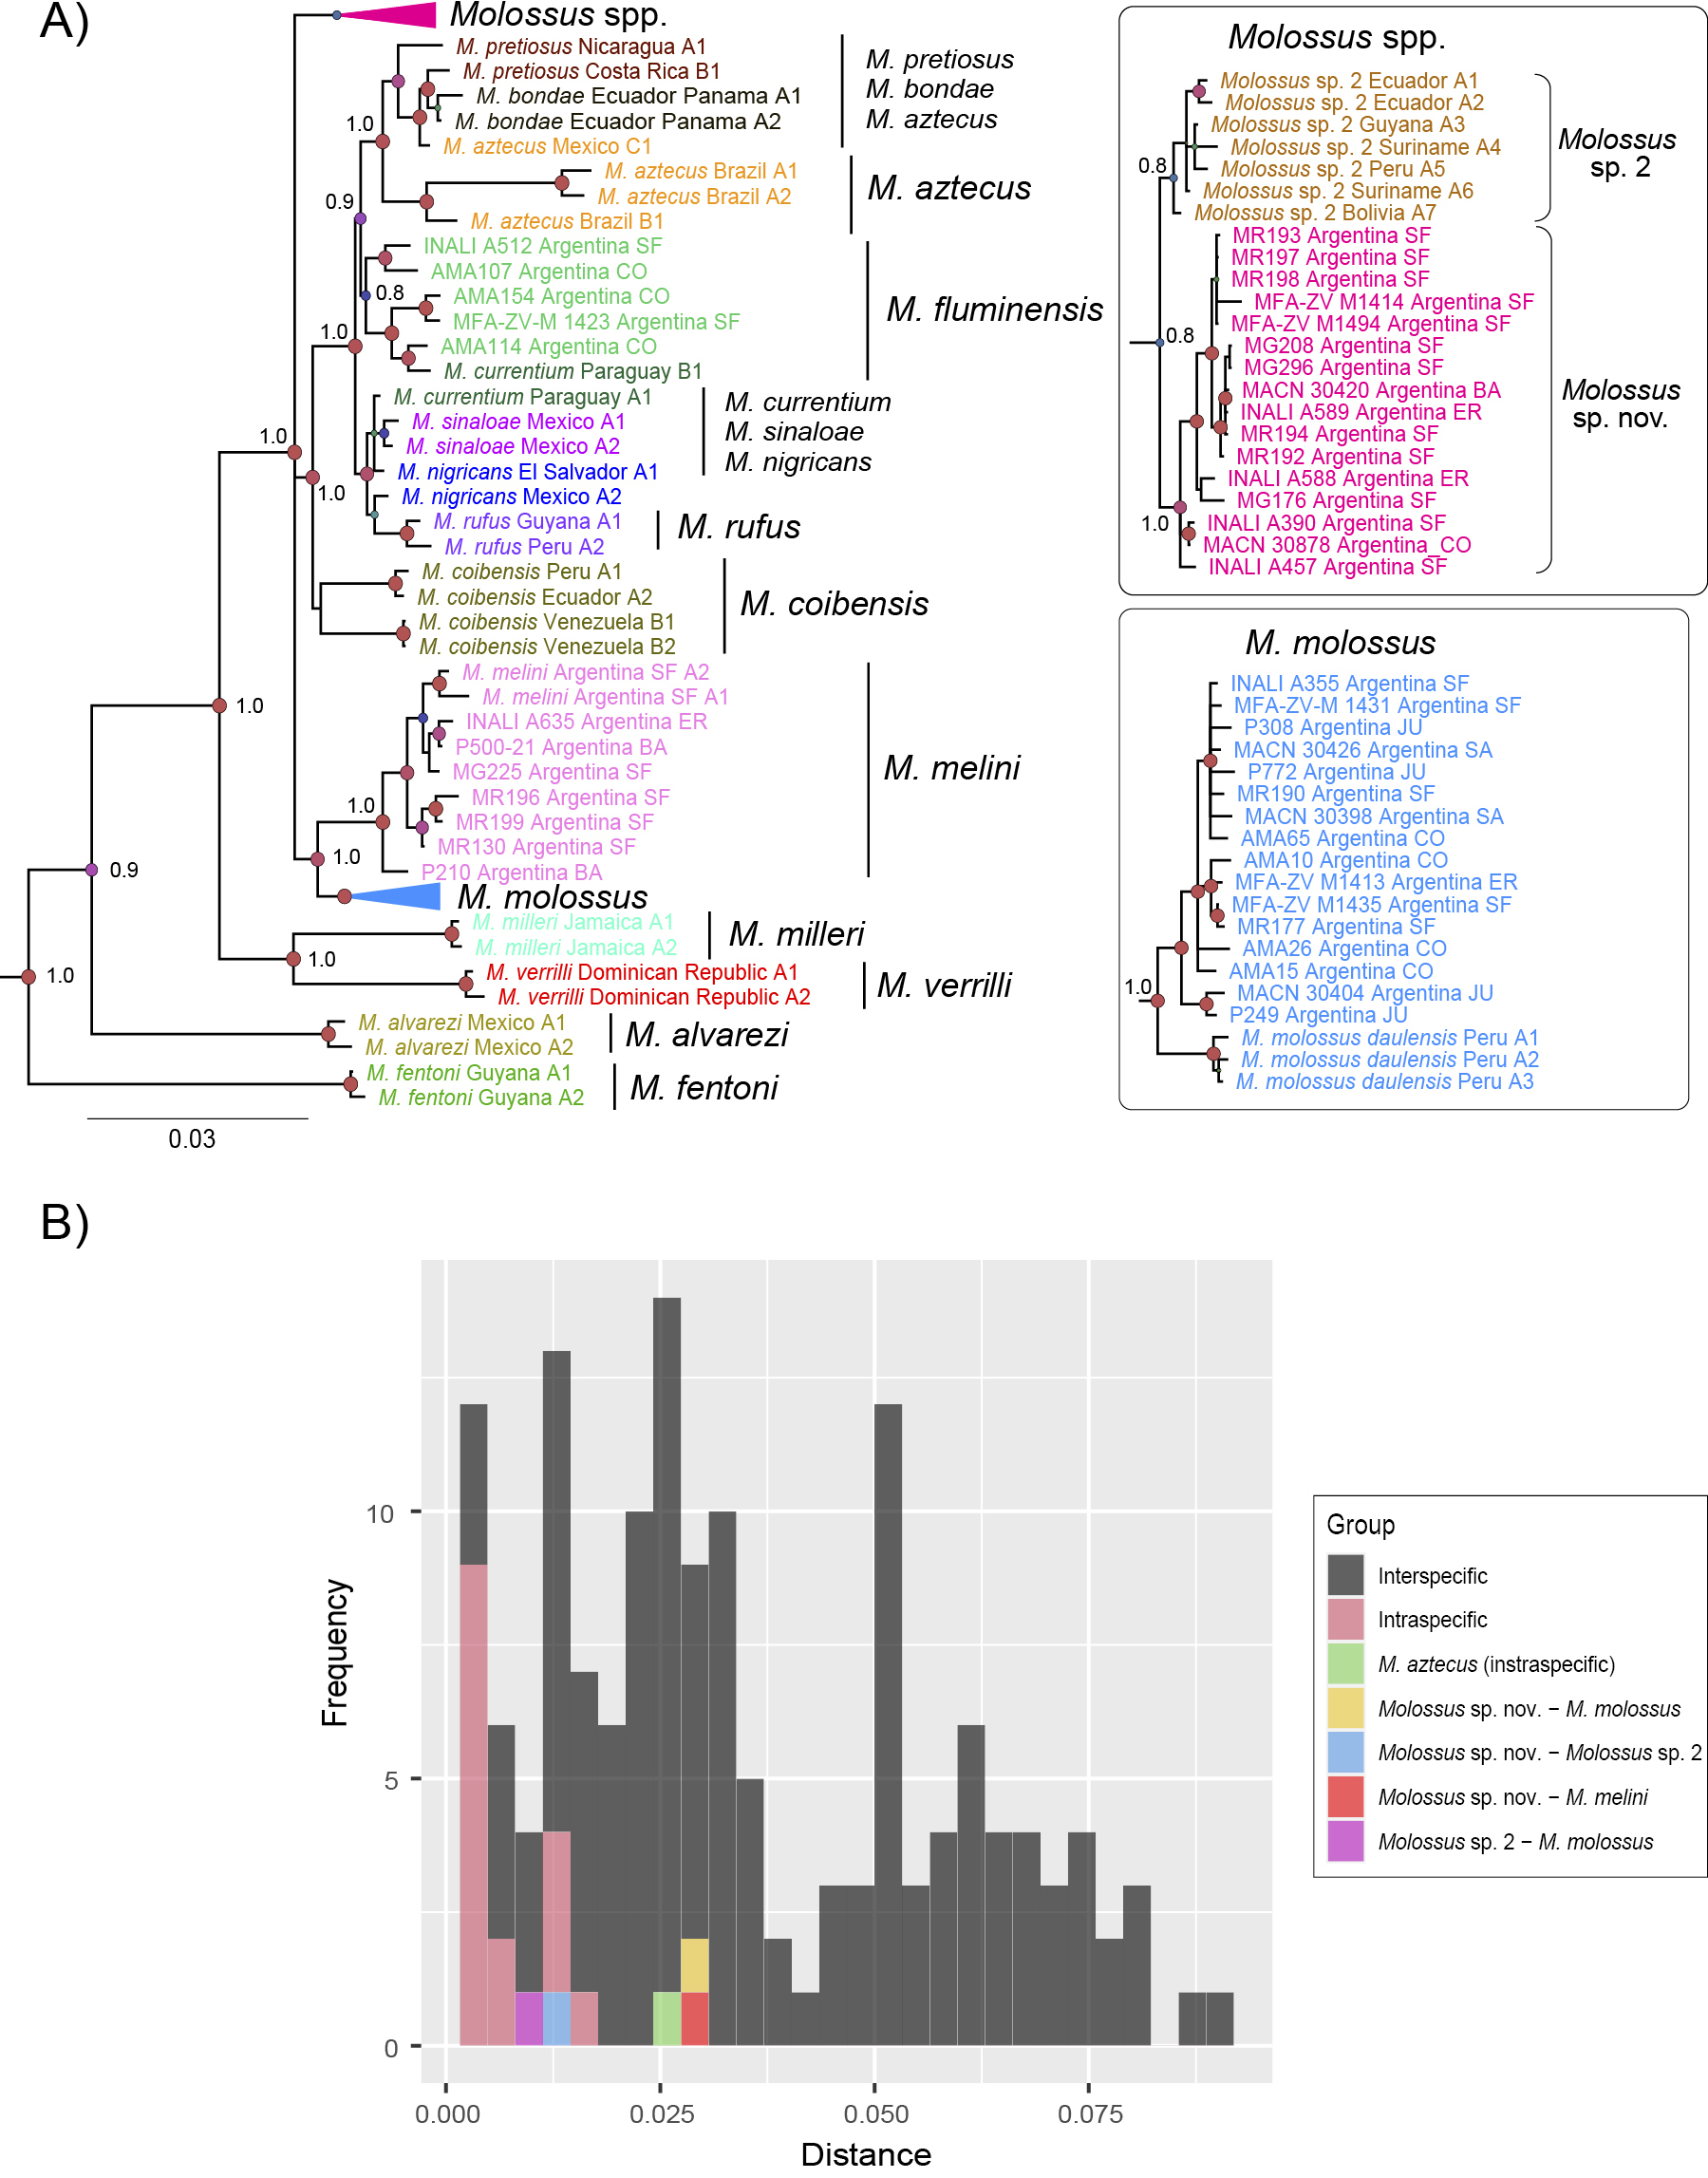
A Bayesian phylogeny obtained from the concatenated dataset (FGB, COI, and cyt b). Branch colors indicate lineage/species membership. The letters accompanying each terminal indicate the lineage based on the analysis of individual genes, while the numbers refer to the number of representatives of each lineage. Node sizes are proportional to their posterior probability (red: 1–0.95; purple-cyan: 0.94–0.75; green-yellow: <0.75). Node support above 0.8 is shown for main lineages. The scale is expressed in substitutions per site. B Uncorrected p distances. Histogram showing intra- and interspecific distances based on the concatenated dataset (FGB, COI, and cyt b). Different colors indicate intraspecific distances (pink), interspecific distances (dark gray), intraspecific distance of M. aztecus (green), distance between Molossus sp. nov. and M. molossus (yellow), distance within Molossus sp. nov. and Molossus sp. 2 (light blue), distance between Molossus sp. nov. and M. melini (red), and distance between M. molossus and Molossus sp. 2 (purple). |