|
||
|
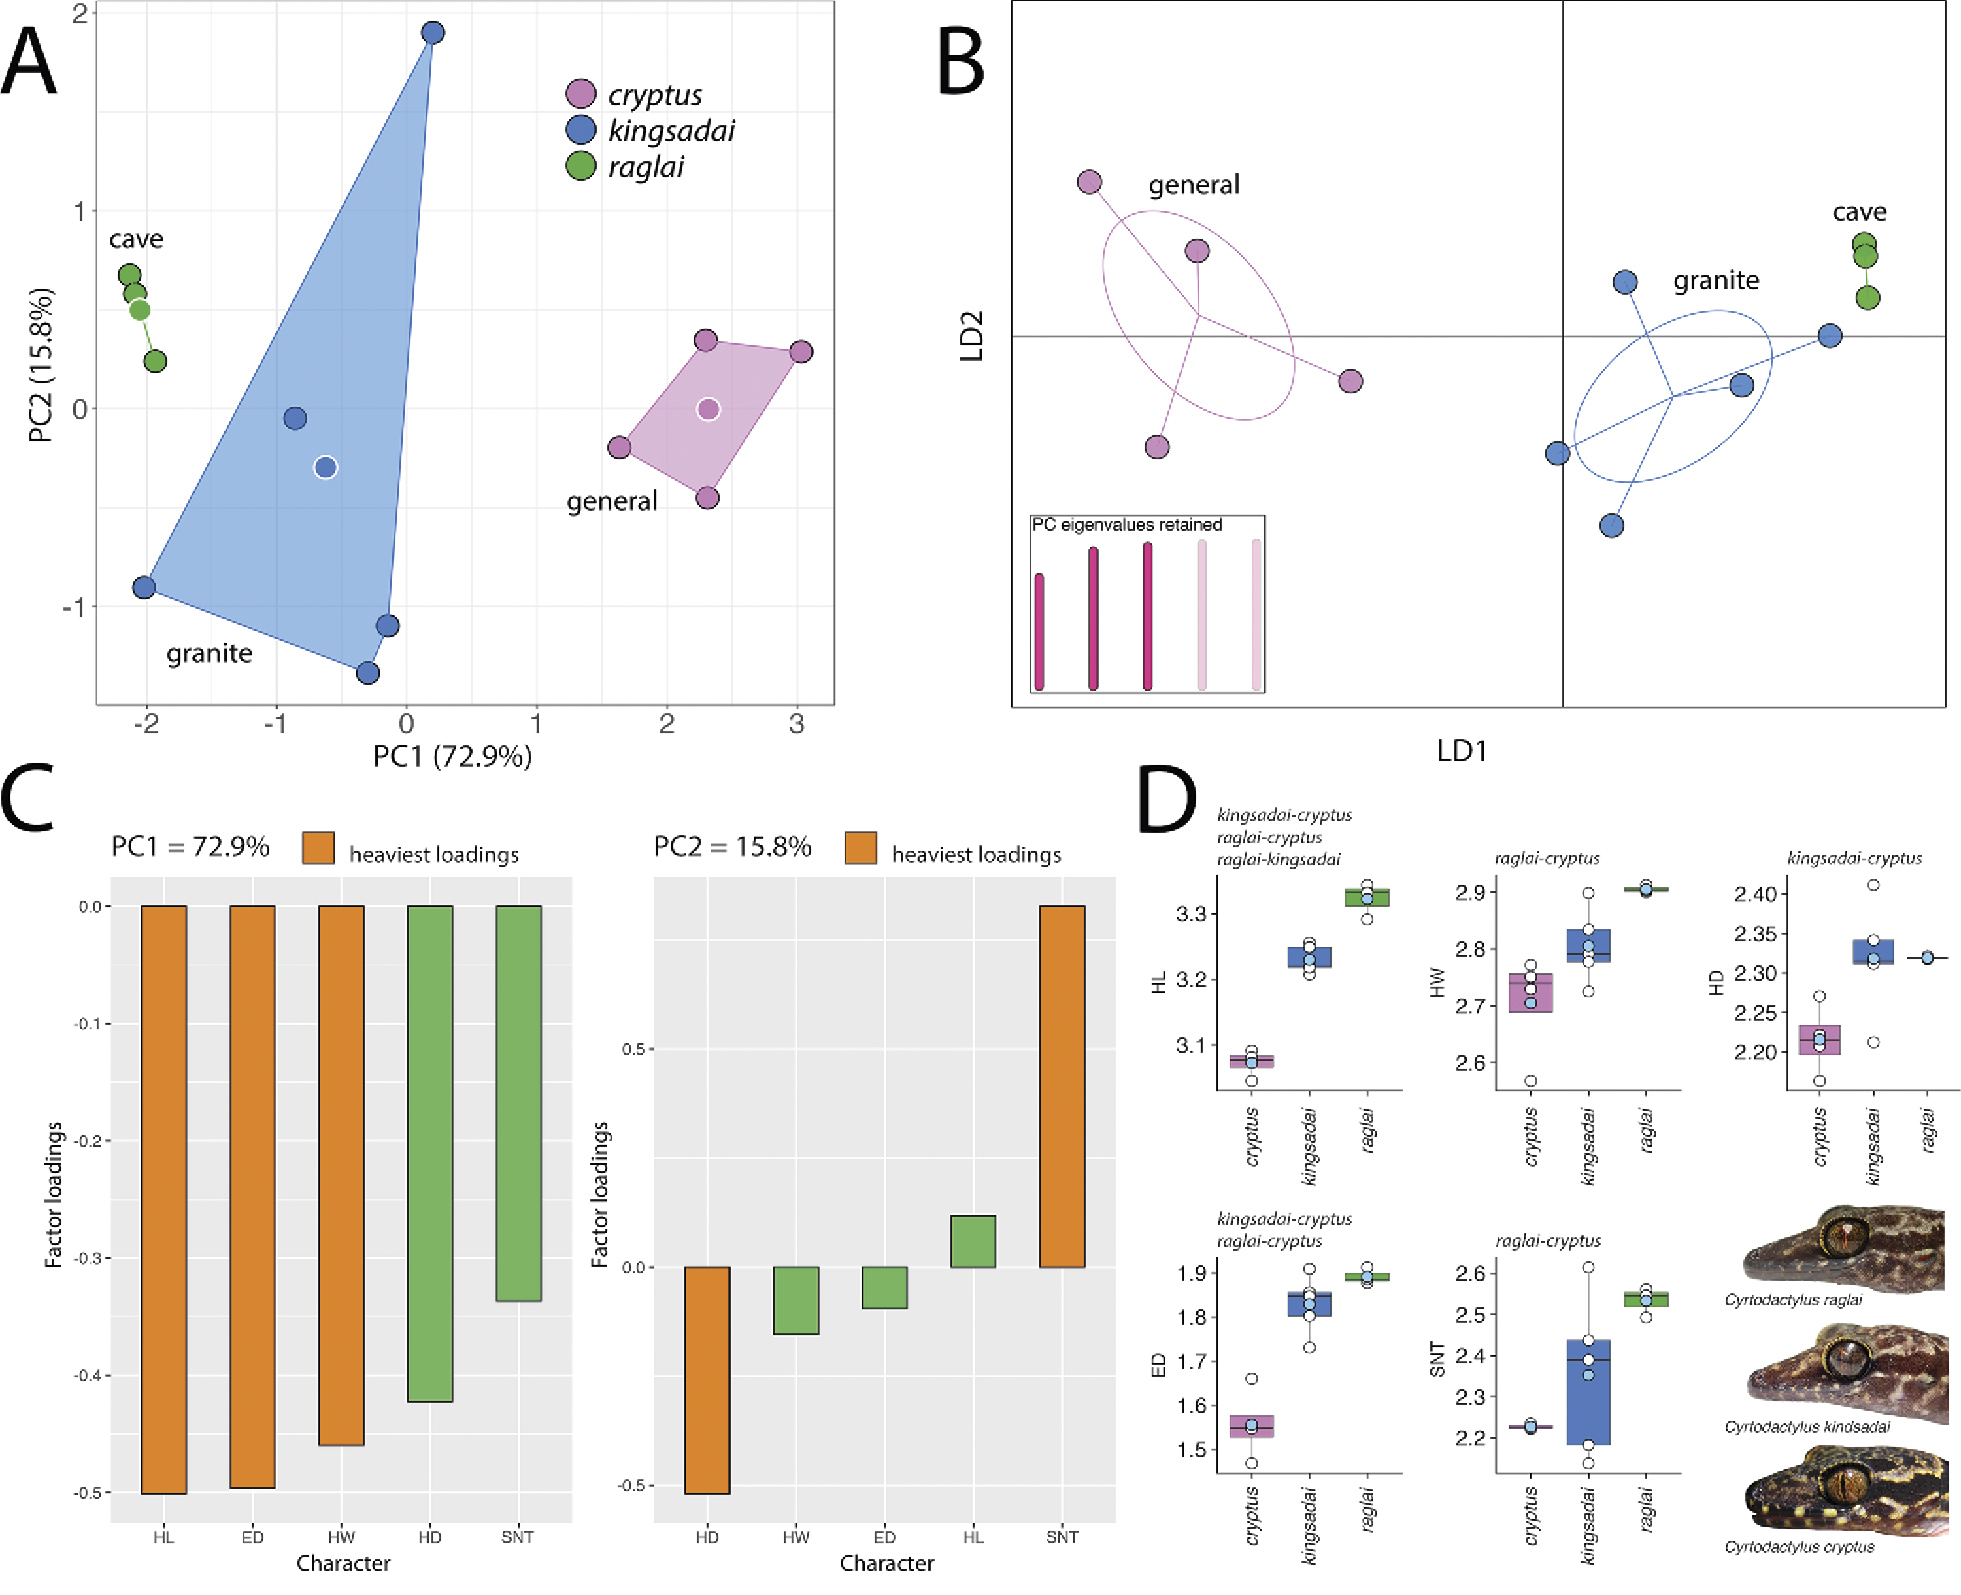
A. PCA of the Cyrtodactylus raglai sp. nov, C. cryptus, and C. kingsdai based on mensural characters. B. DAPC of same. C. Histograms of the factor loadings of the characters contributing the most to the variation along PC1 and PC2. D. Boxplot comparisons of meristic characters. Light-blue circles are means and black horizontal bars are medians. Species pairs above the plots are those that differ significantly (p < 0.05) from each other based on the ANOVAs and TukeyHSDs. Photographs by Anh The Nguyen. |