|
||
|
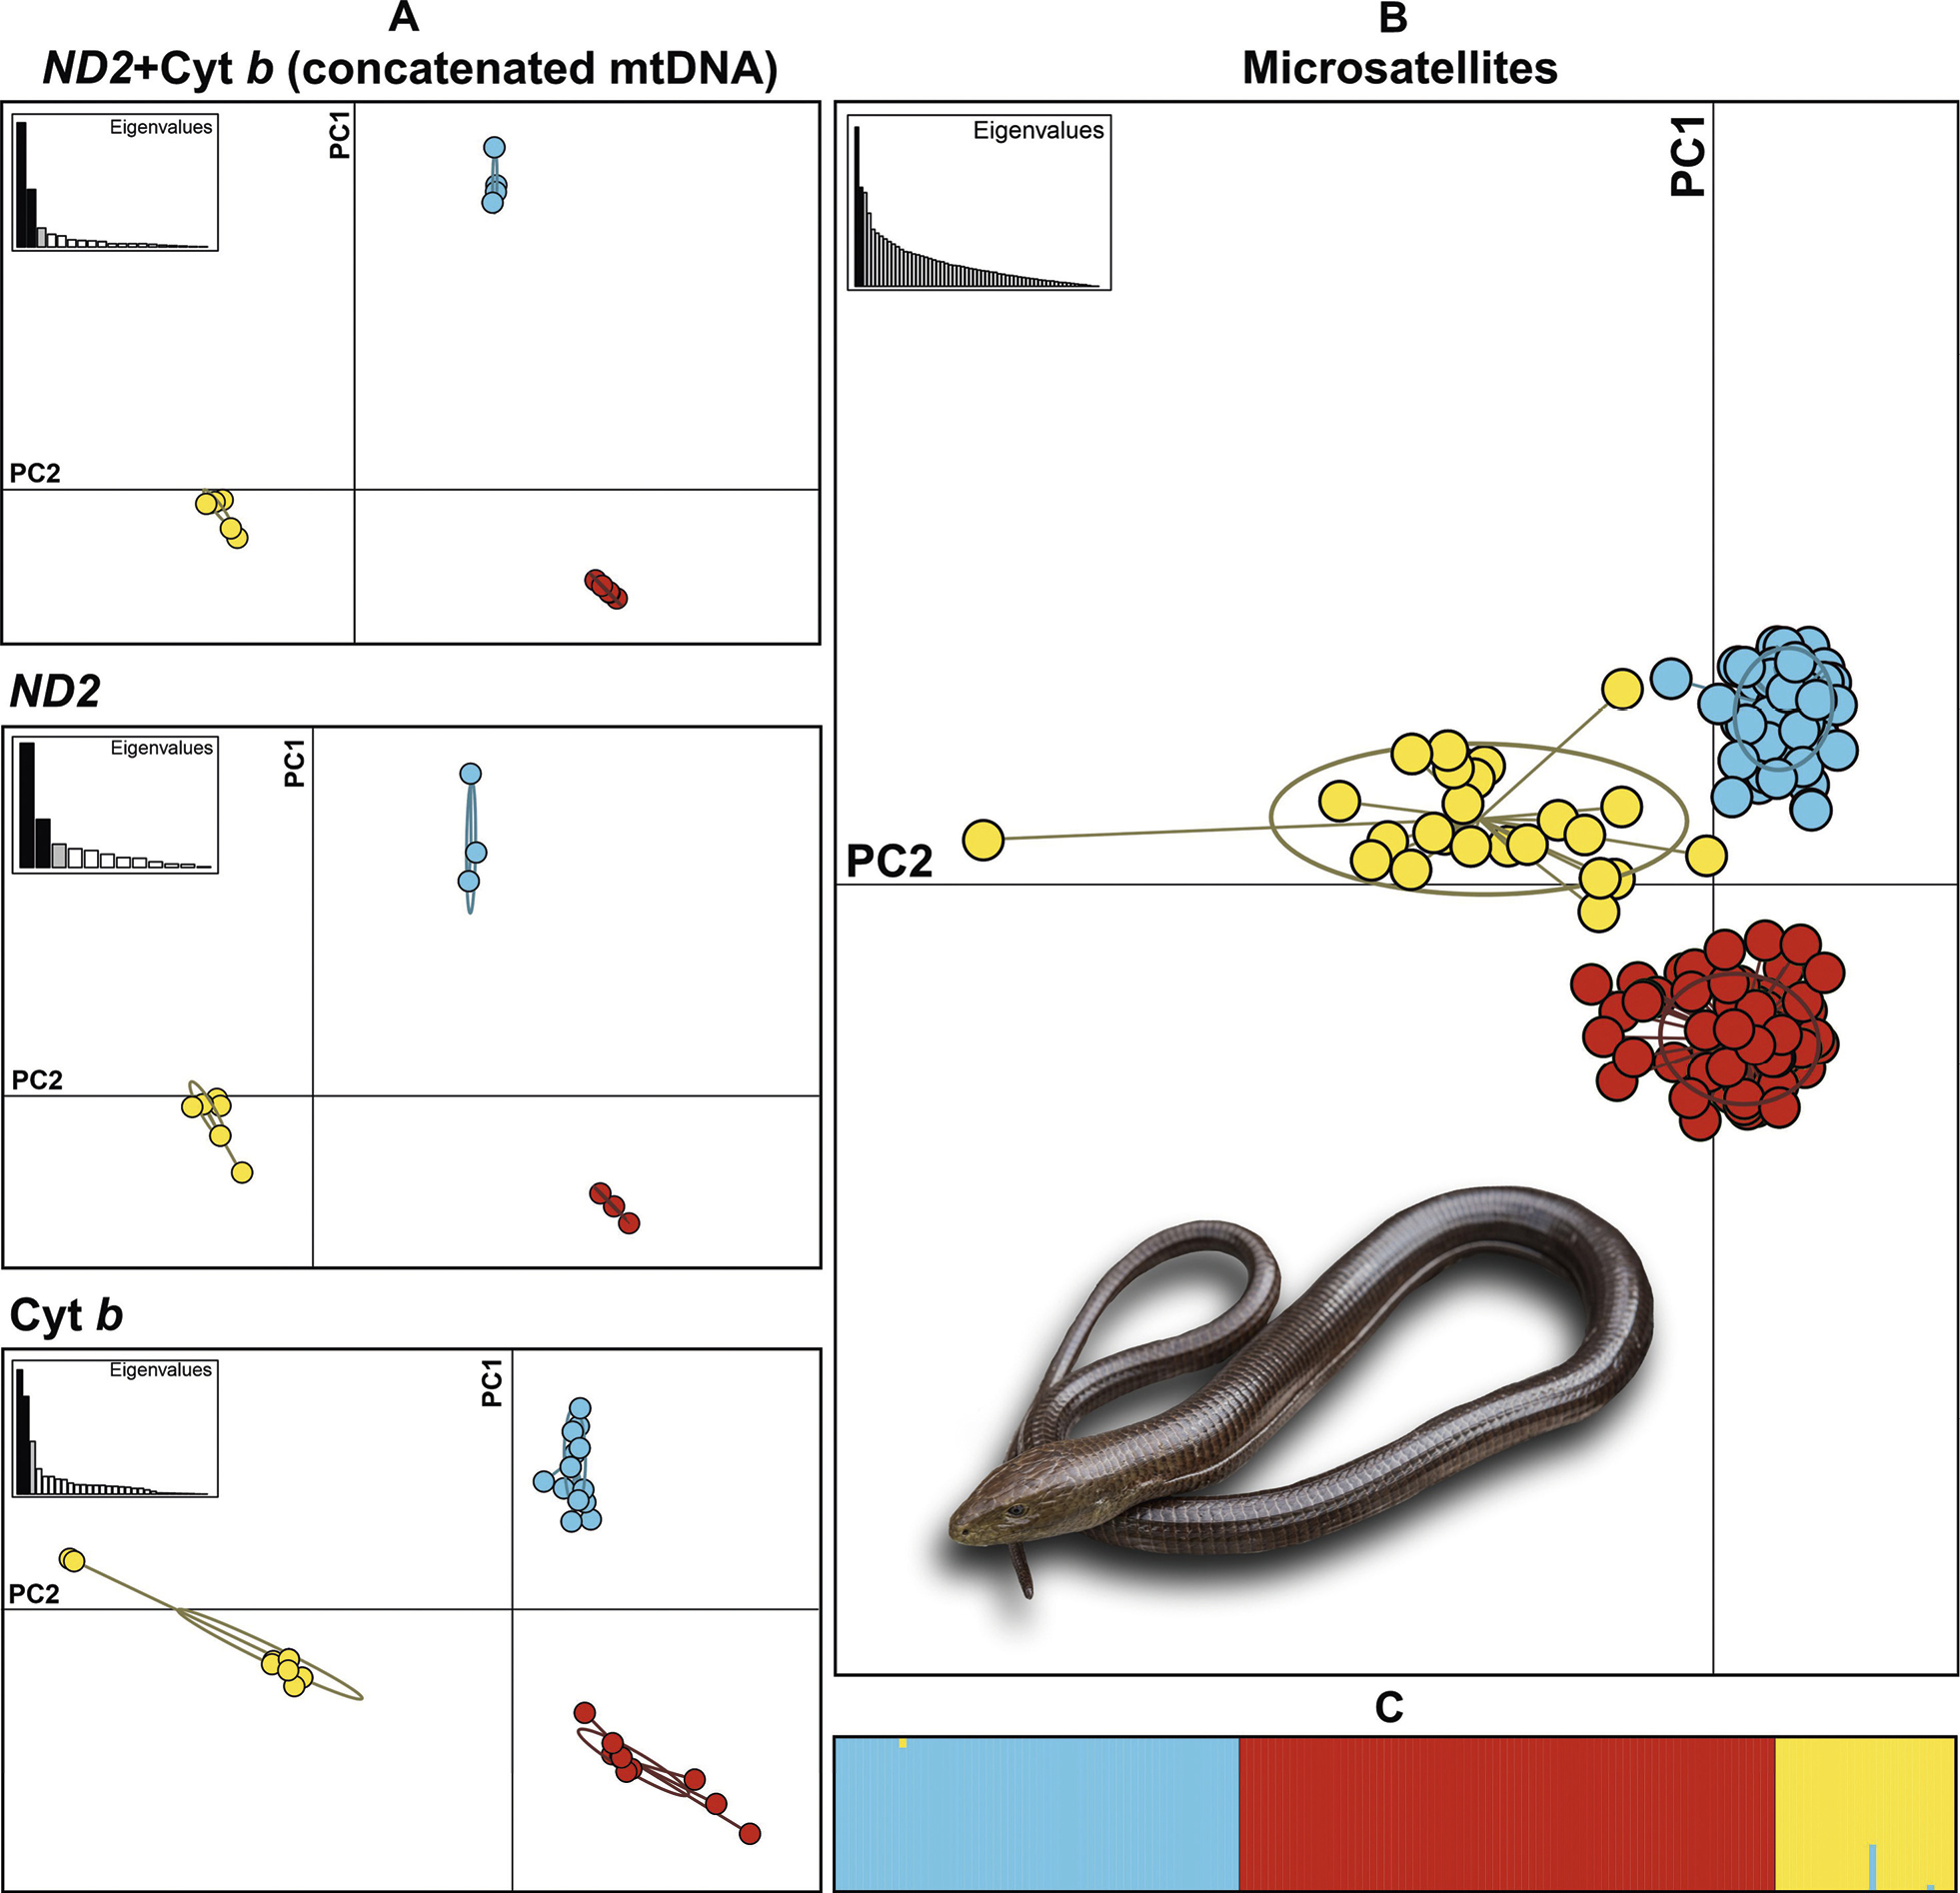
Principal Component Analysis (PCA) of three lineages of Pseudopus apodus for mitochondrial DNA (A) and microsatellite data (B) with the Structure plot of posterior probabilities for K=3 (C). The oval outlines in PCAs represent 95% confidence intervals. First (PC1) and second (PC2) principal components explain 45.9% and 21.3% of the observed variance in the concatenated dataset, 44.9% and 17.4% in ND2 dataset, 26.3% and 20.7% in Cyt b dataset, and 10.8% and 6.7% in microsatellites, respectively. The plot of two principal components shows a clear separation between three groups of samples. Color scheme corresponds with the one used in Fig. 2: P. a. apodus (red), P. a. thracius (blue) and P. a. levantinus ssp. nov. (yellow). |