|
||
|
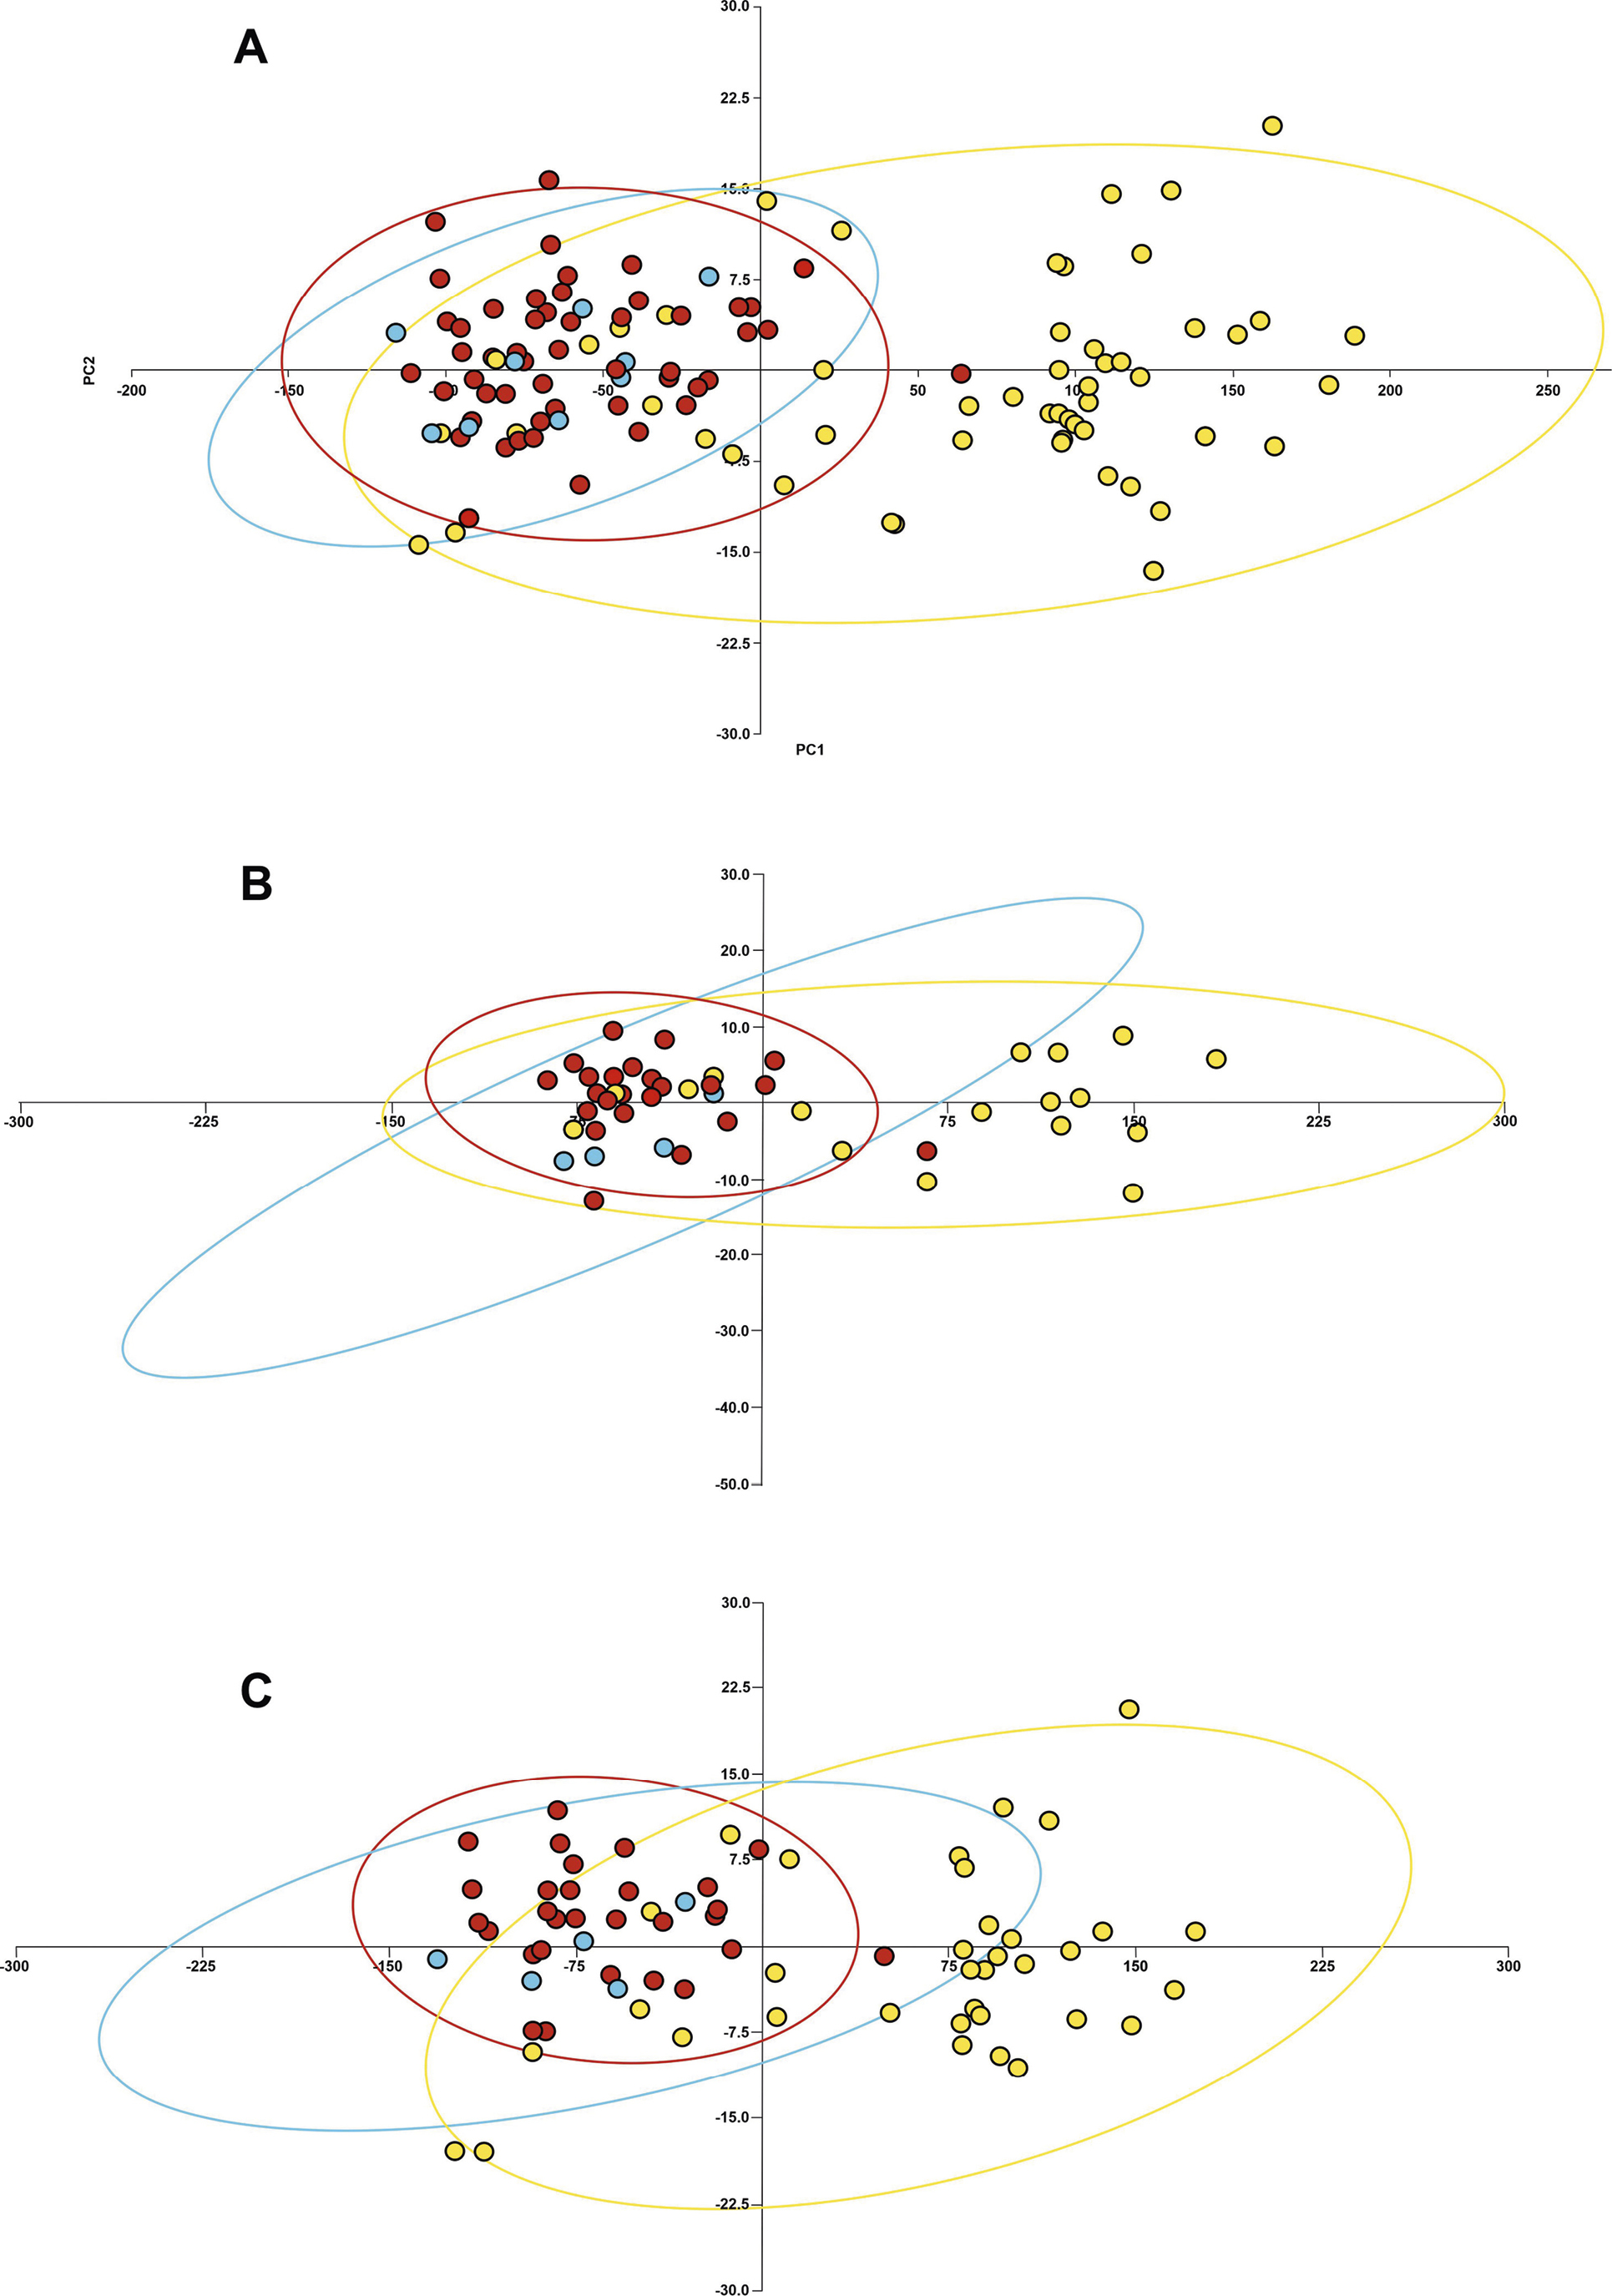
Principal Component Analysis (PCA) of the examined phenotypic characters among the adult specimens of Pseudopus apodus apodus (red dots), P. a. thracius (blue dots), and P. a. levantinus ssp. nov. (yellow dots): A - adult females and males together, B – females only, C – males only. The oval outlines correspond to 95% confidence intervals. For A, PC1 explains 98.7% of variance, PC2 0.59%; for B, PC1 explains 98.9% of variance, PC2 0.45%; for C, PC1 explains 98.6%, PC2 0.59% (see details in Table S5), respectively. |