|
||
|
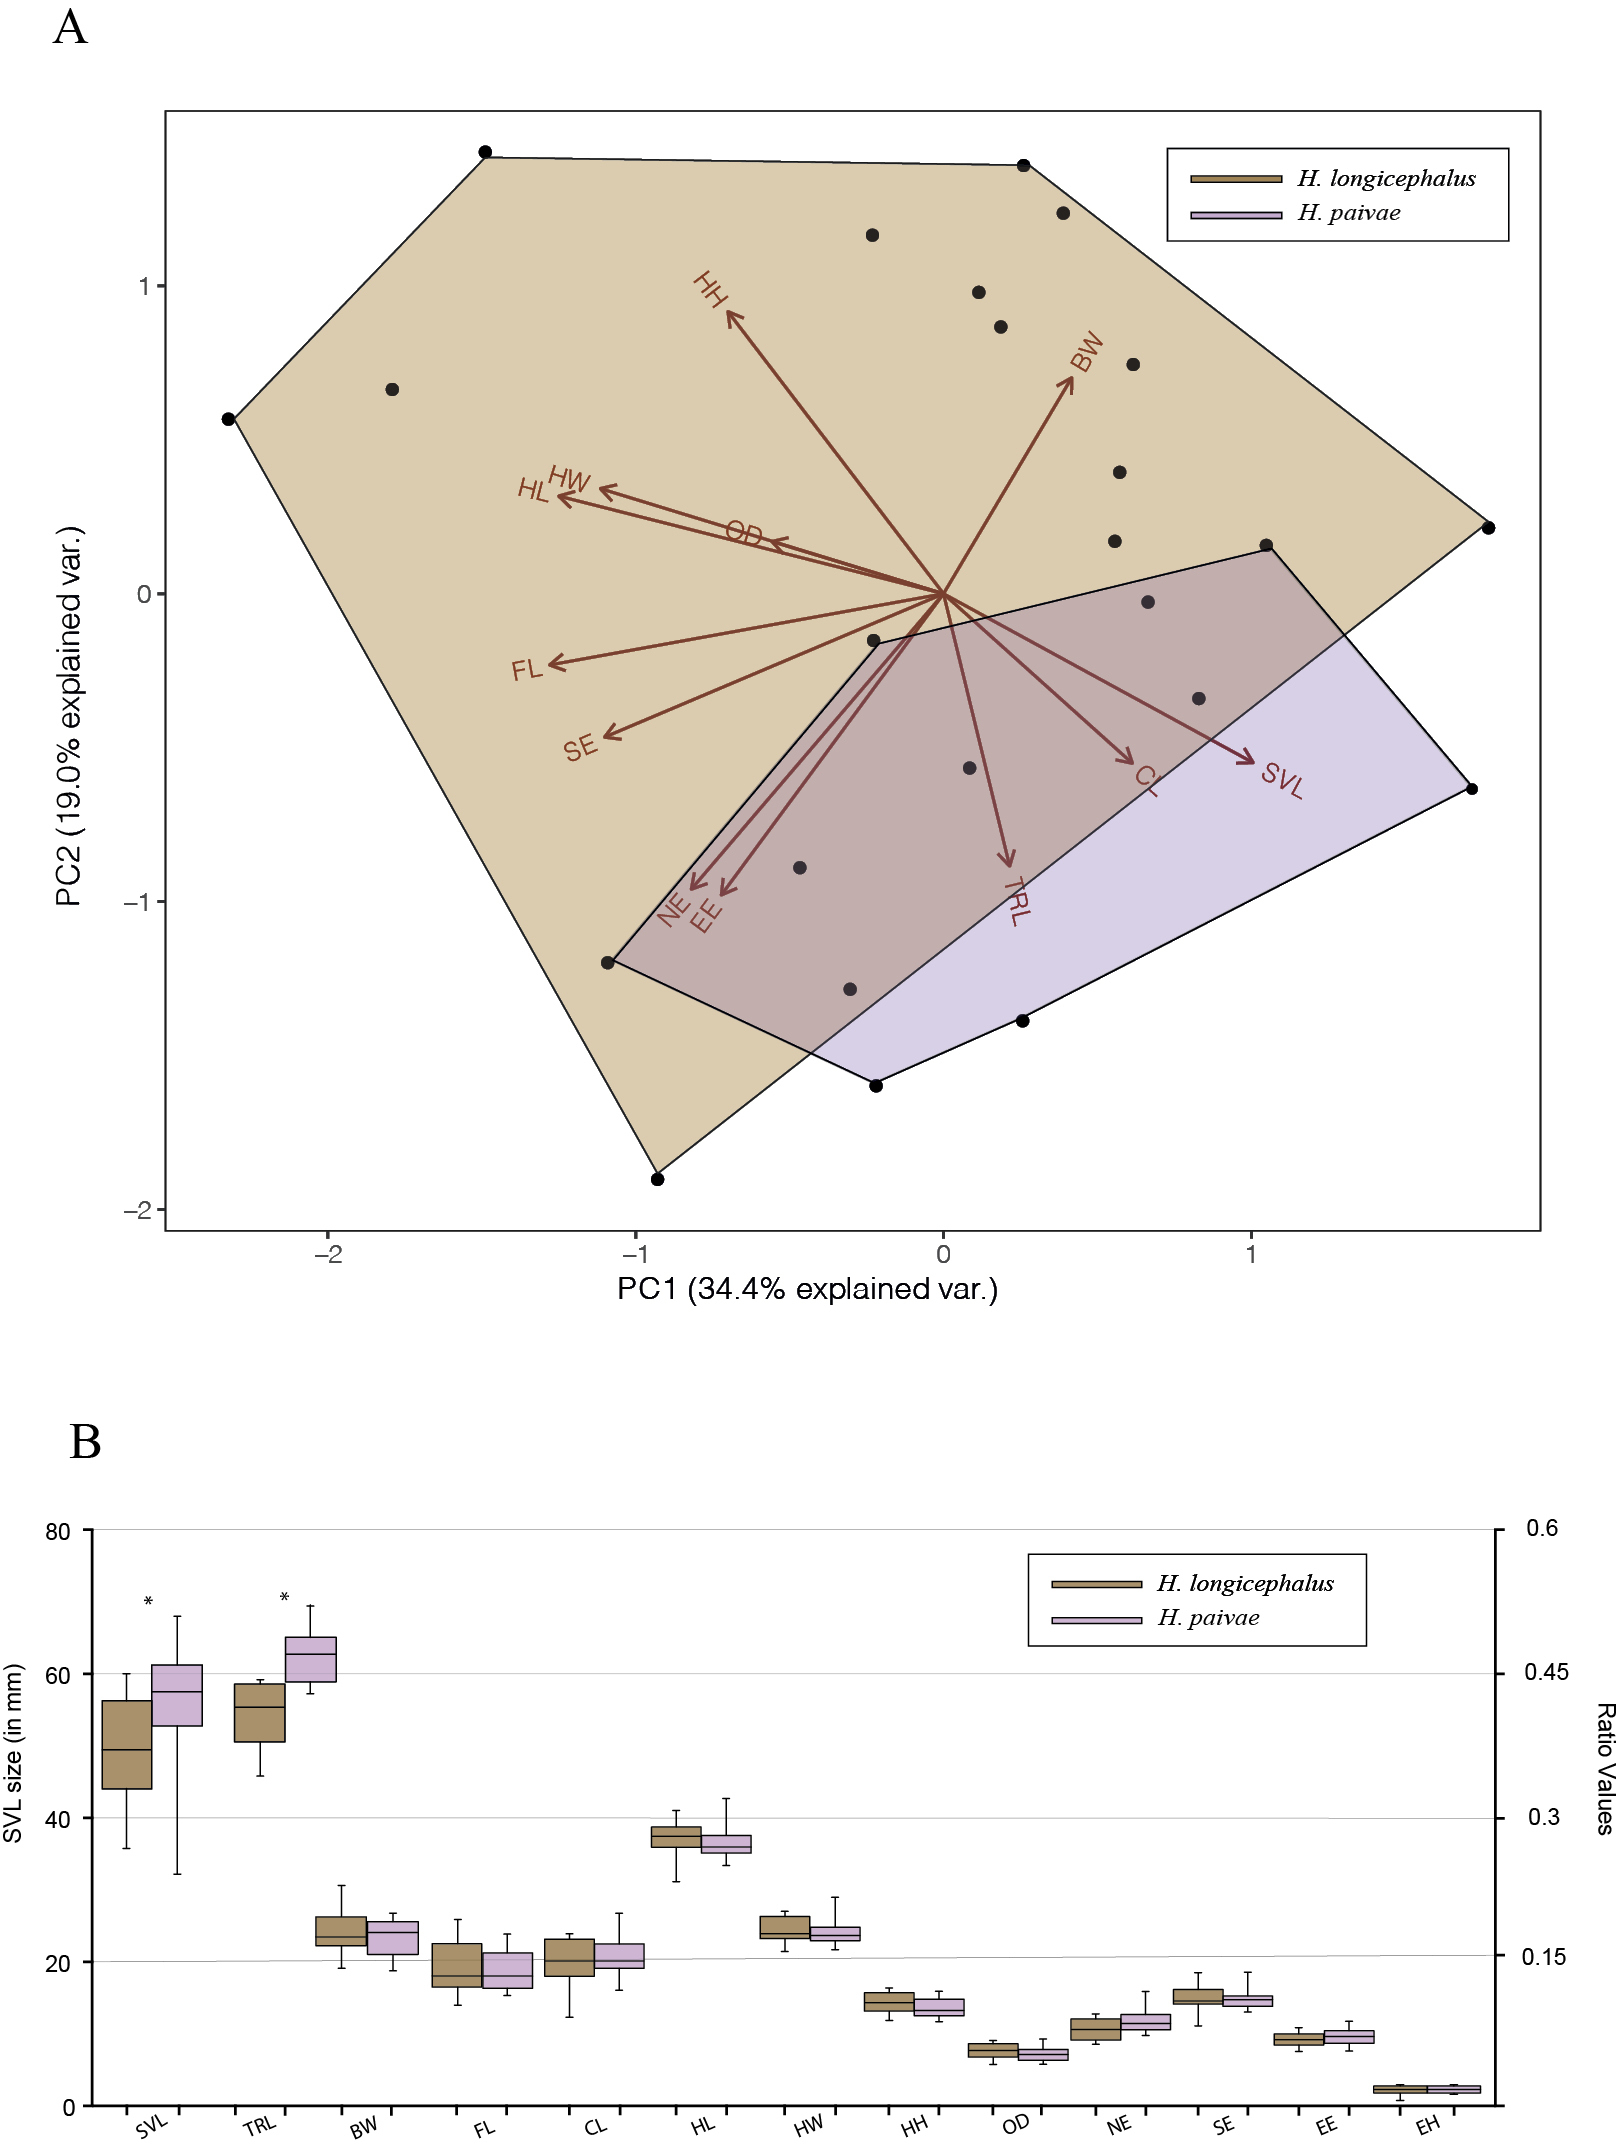
A – PCA plots of the first principal component (PC 1) versus the second (PC 2) of morphometric analysis for H. longicephalus–complex. Light brown polygon denote distribution within PCAs of H. longicephalus and pink polygon H. paivae. B – Statistical distribution of morphometric parameters examined by ANOVA. Significant t–values are highlighted by an asterisk (*). For abbreviations see Material and Methods section |