|
||
|
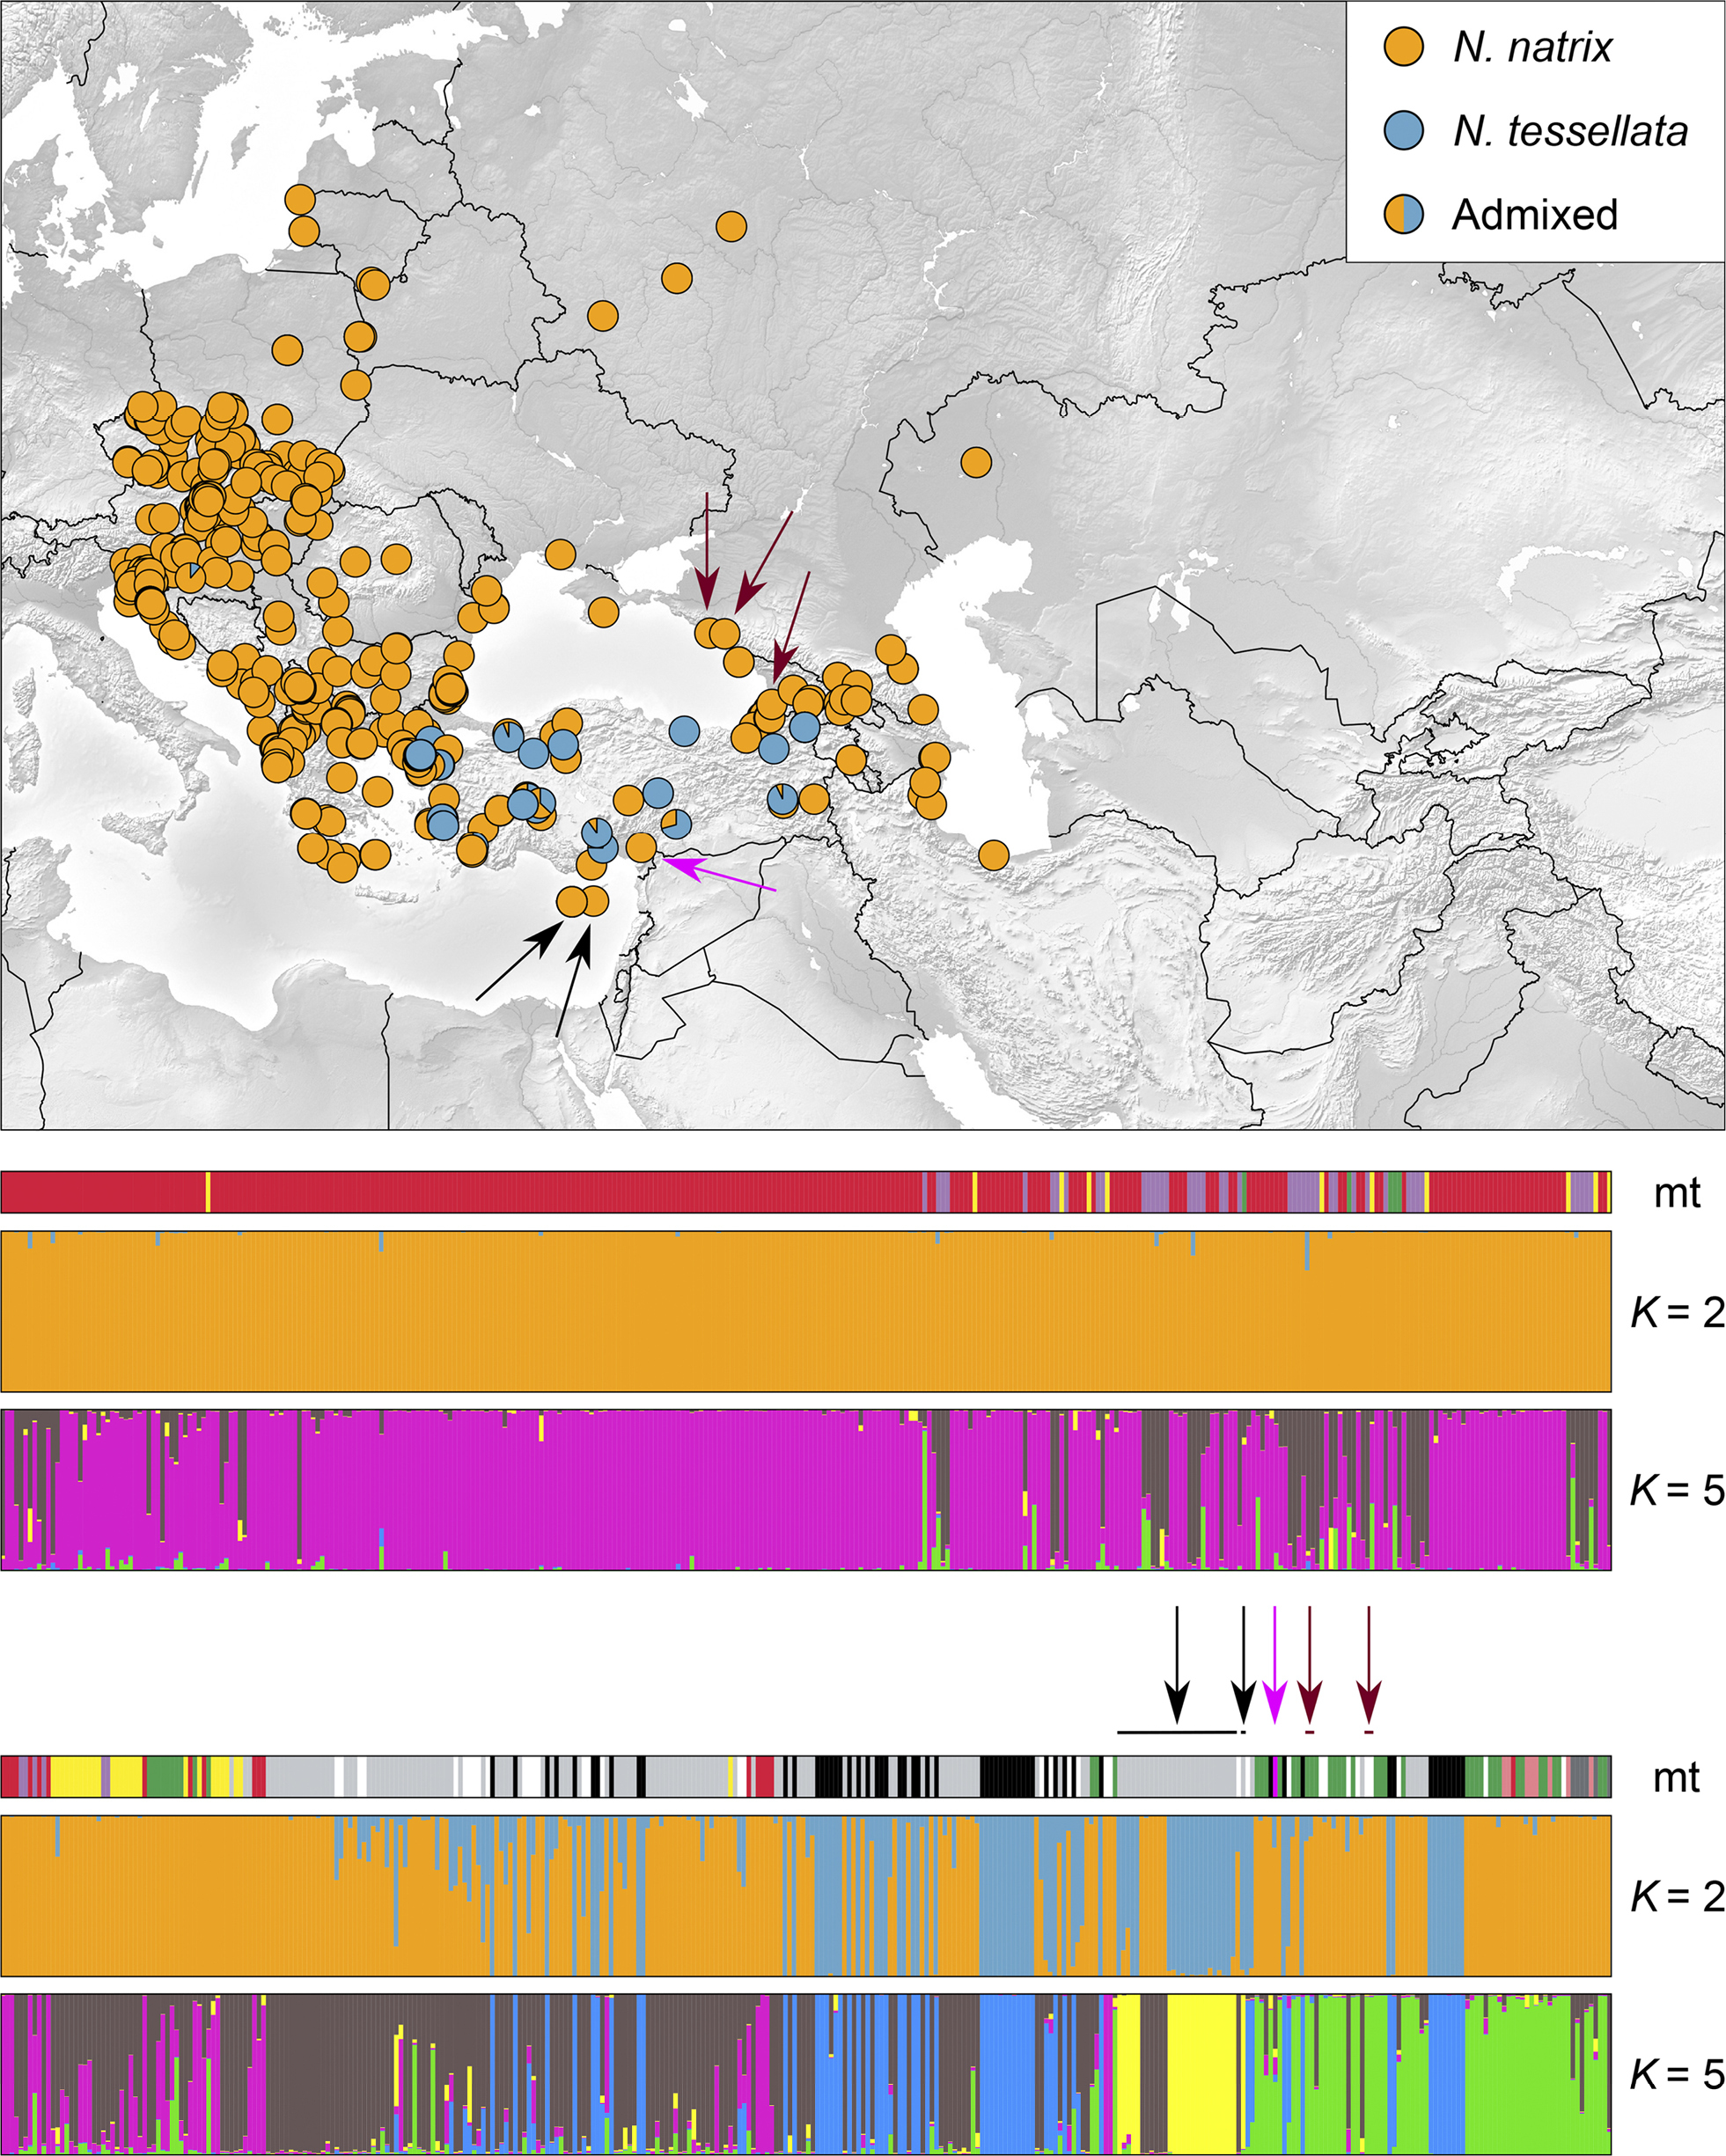
Genotypic structuring of grass snakes and dice snakes in the study region (n = 705). In the map, the four clusters representing Natrix natrix under K = 5 are merged and shown in orange. Admixed ancestries are depicted as pie chart sectors according to Q values as explained in the text. In the bar plots below the map, samples are represented by three bars, indicating their mitochondrial lineage (top) and their inferred structure cluster membership under K = 2 and K = 5 (center and bottom). Mitochondrial lineages of N. natrix are color-coded as in Figure 1. However, the two mitochondrial lineages of N. tessellata are shown in black to contrast them from N. natrix. White indicates missing mtDNA data. Samples are arranged from west to east. In the structure diagrams, an individual is represented by a vertical segment that reflects its ancestry. The black arrows highlight samples from Cyprus; the dark red arrows, samples identified as N. megalocephala; and the pink arrow indicates the only grass snake with mitochondrial lineage 6 of N. natrix. |