|
||
|
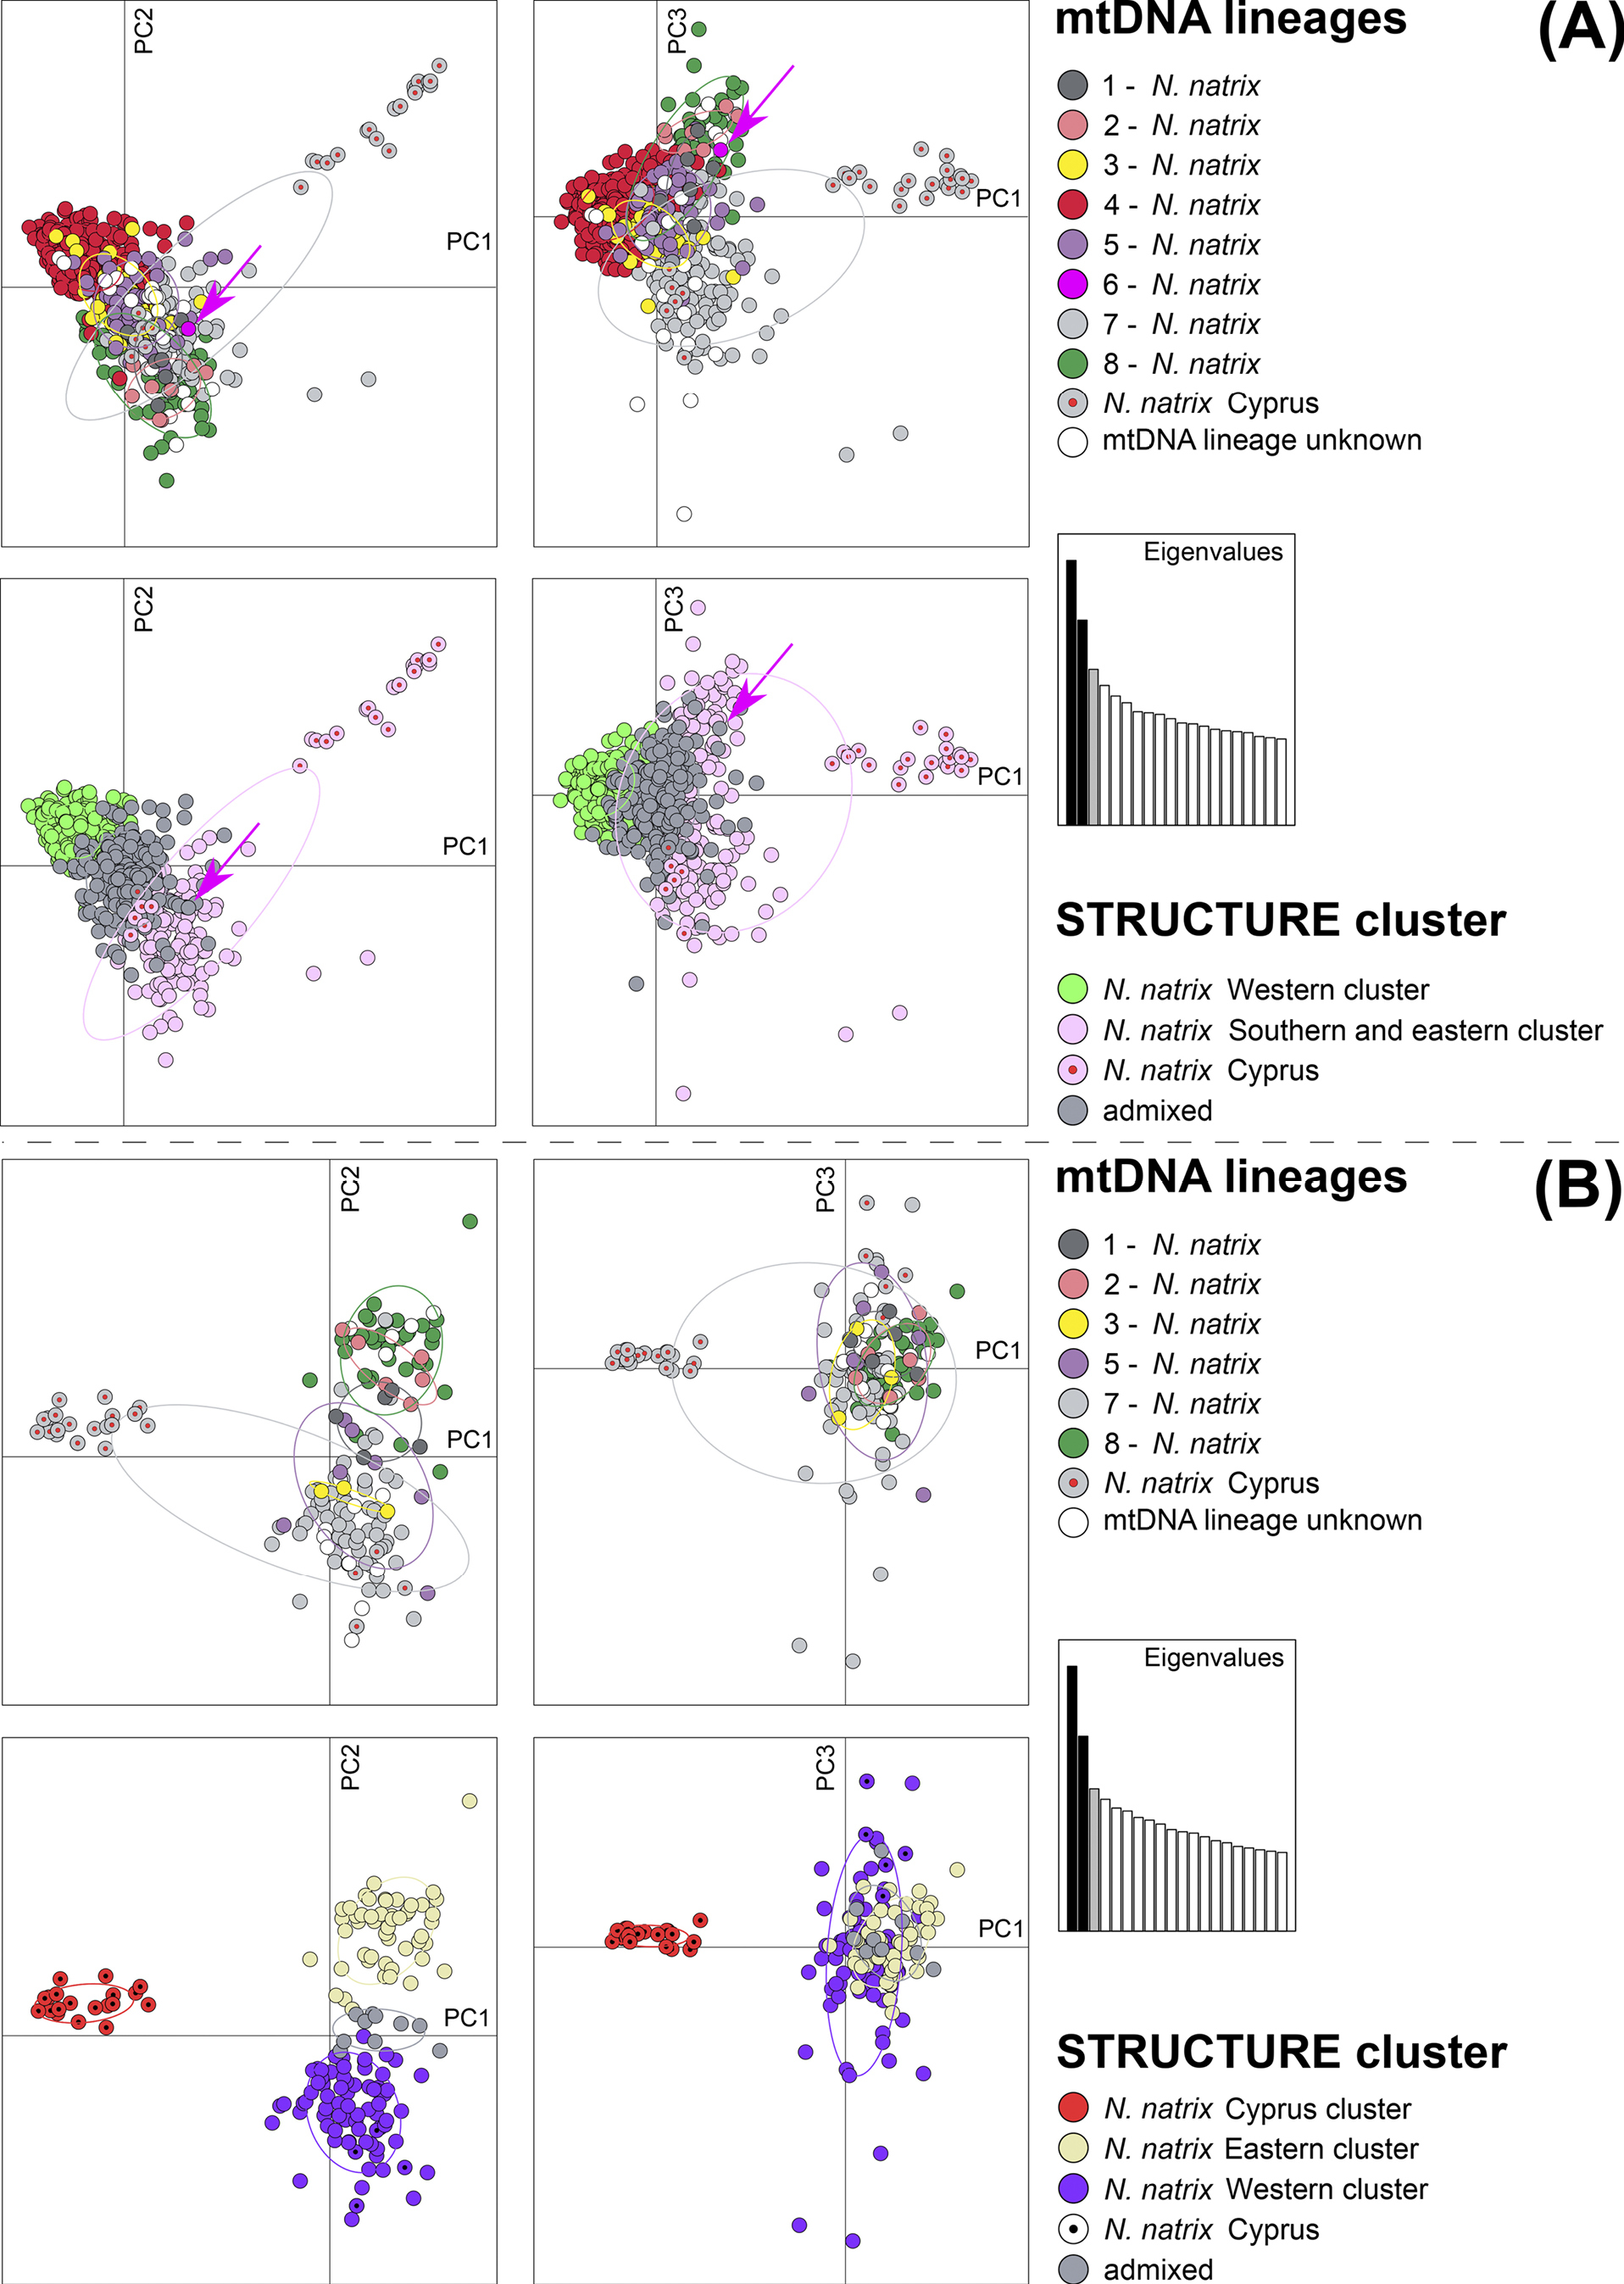
Principal Component Analyses for microsatellite data of (A) pure Natrix natrix (n = 626) and (B) N. natrix of the southern and eastern cluster (n = 159). The same datasets were used as for structure analyses. Samples are colored according to their mitochondrial lineage or structure cluster membership. Thresholds for admixed samples were the same as used for structure. Oval outlines correspond to 95% confidence intervals. For (A) PC1 explains 2.82% of variance, PC2 2.18%, and PC3 1.66%; for (B) PC1 explains 4.78% of variance, PC2 3.52%, and PC3 2.57%. The pink arrows highlight a snake corresponding to mitochondrial lineage 6 of N. natrix. |