|
||
|
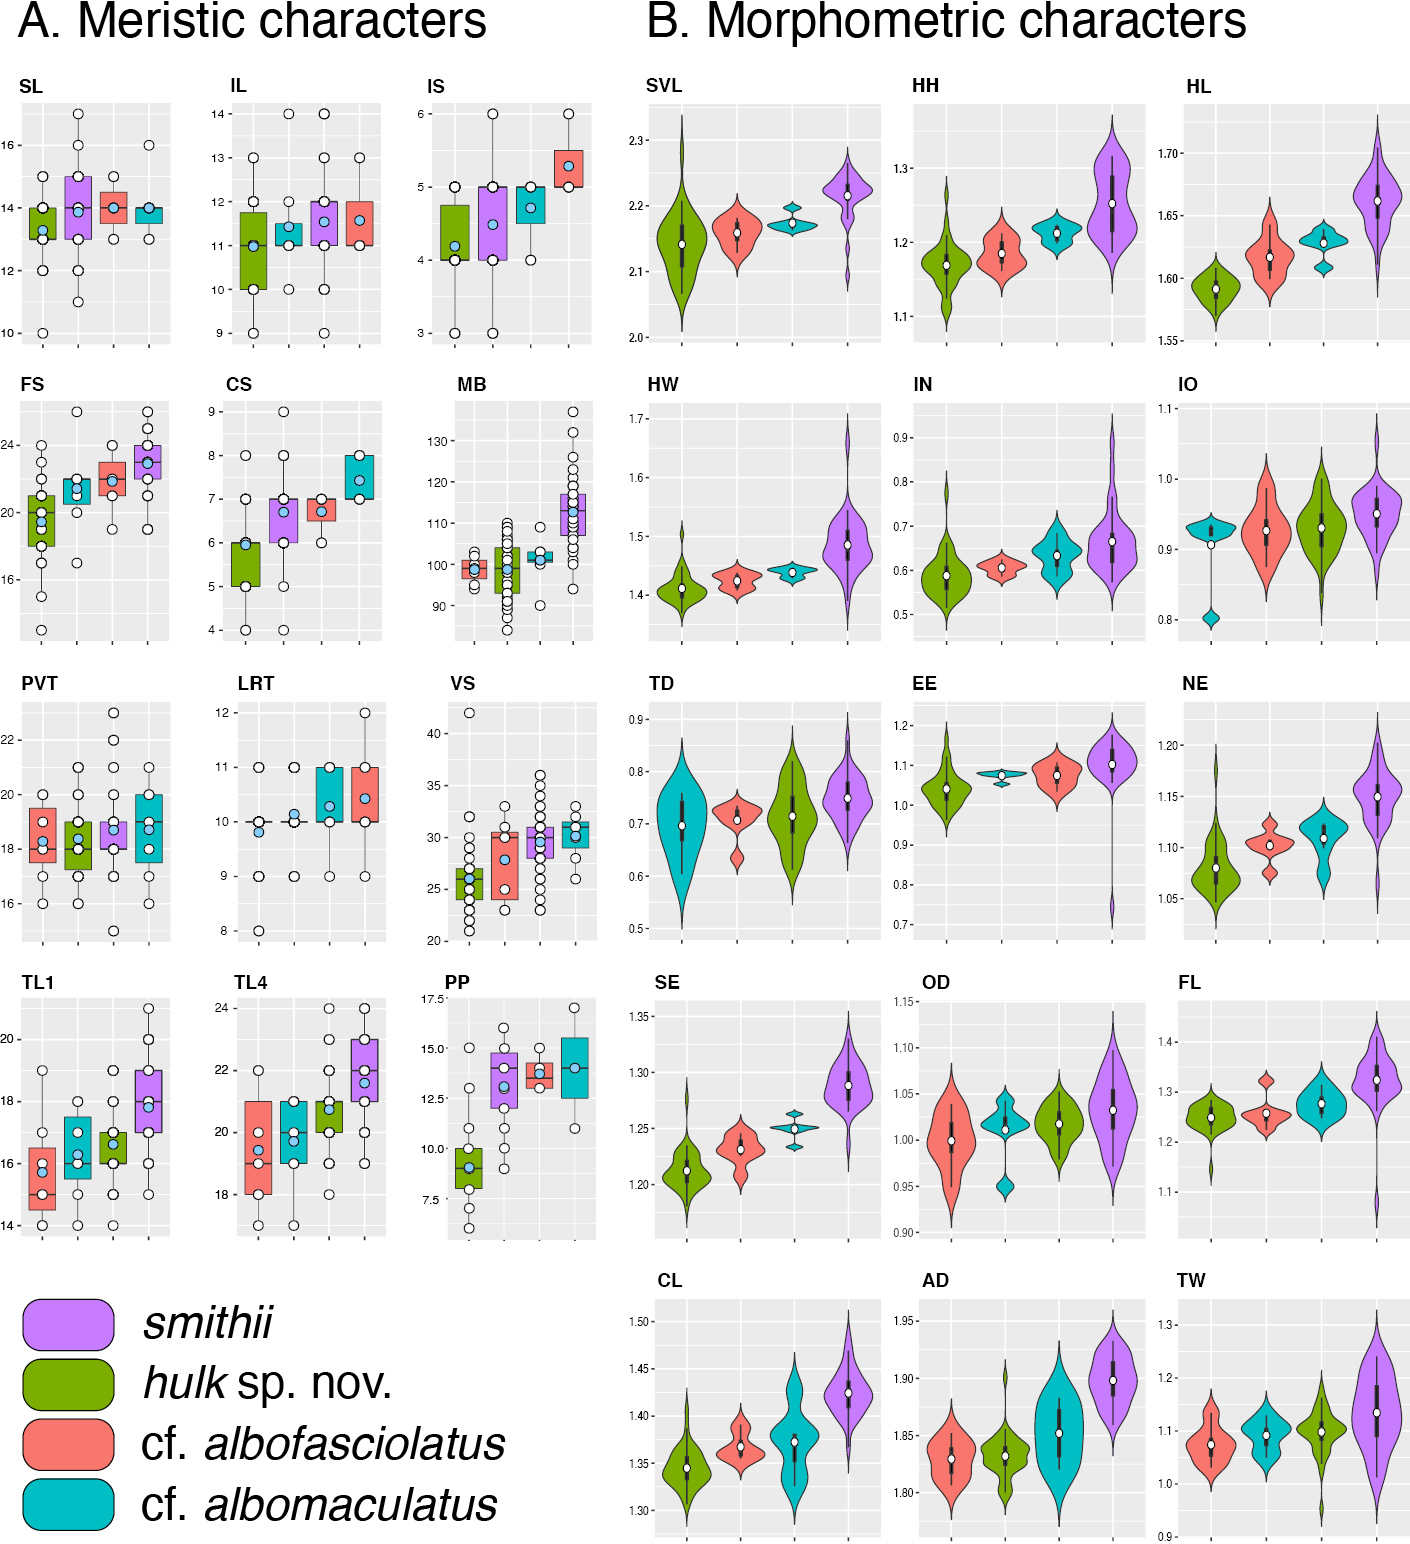
A. Box plots of meristic characters showing the range, mean (blue dot), and 50% quartile (rectangle) for each character. White dots are y-axis values. B. Violin plots of mensural characters embedded with boxplots showing the range, frequency, mean (white dot), and 50% quartile (black rectangle) for each character. Violin plots are vertically oriented mirror-imaged frequency diagrams. |