|
||
|
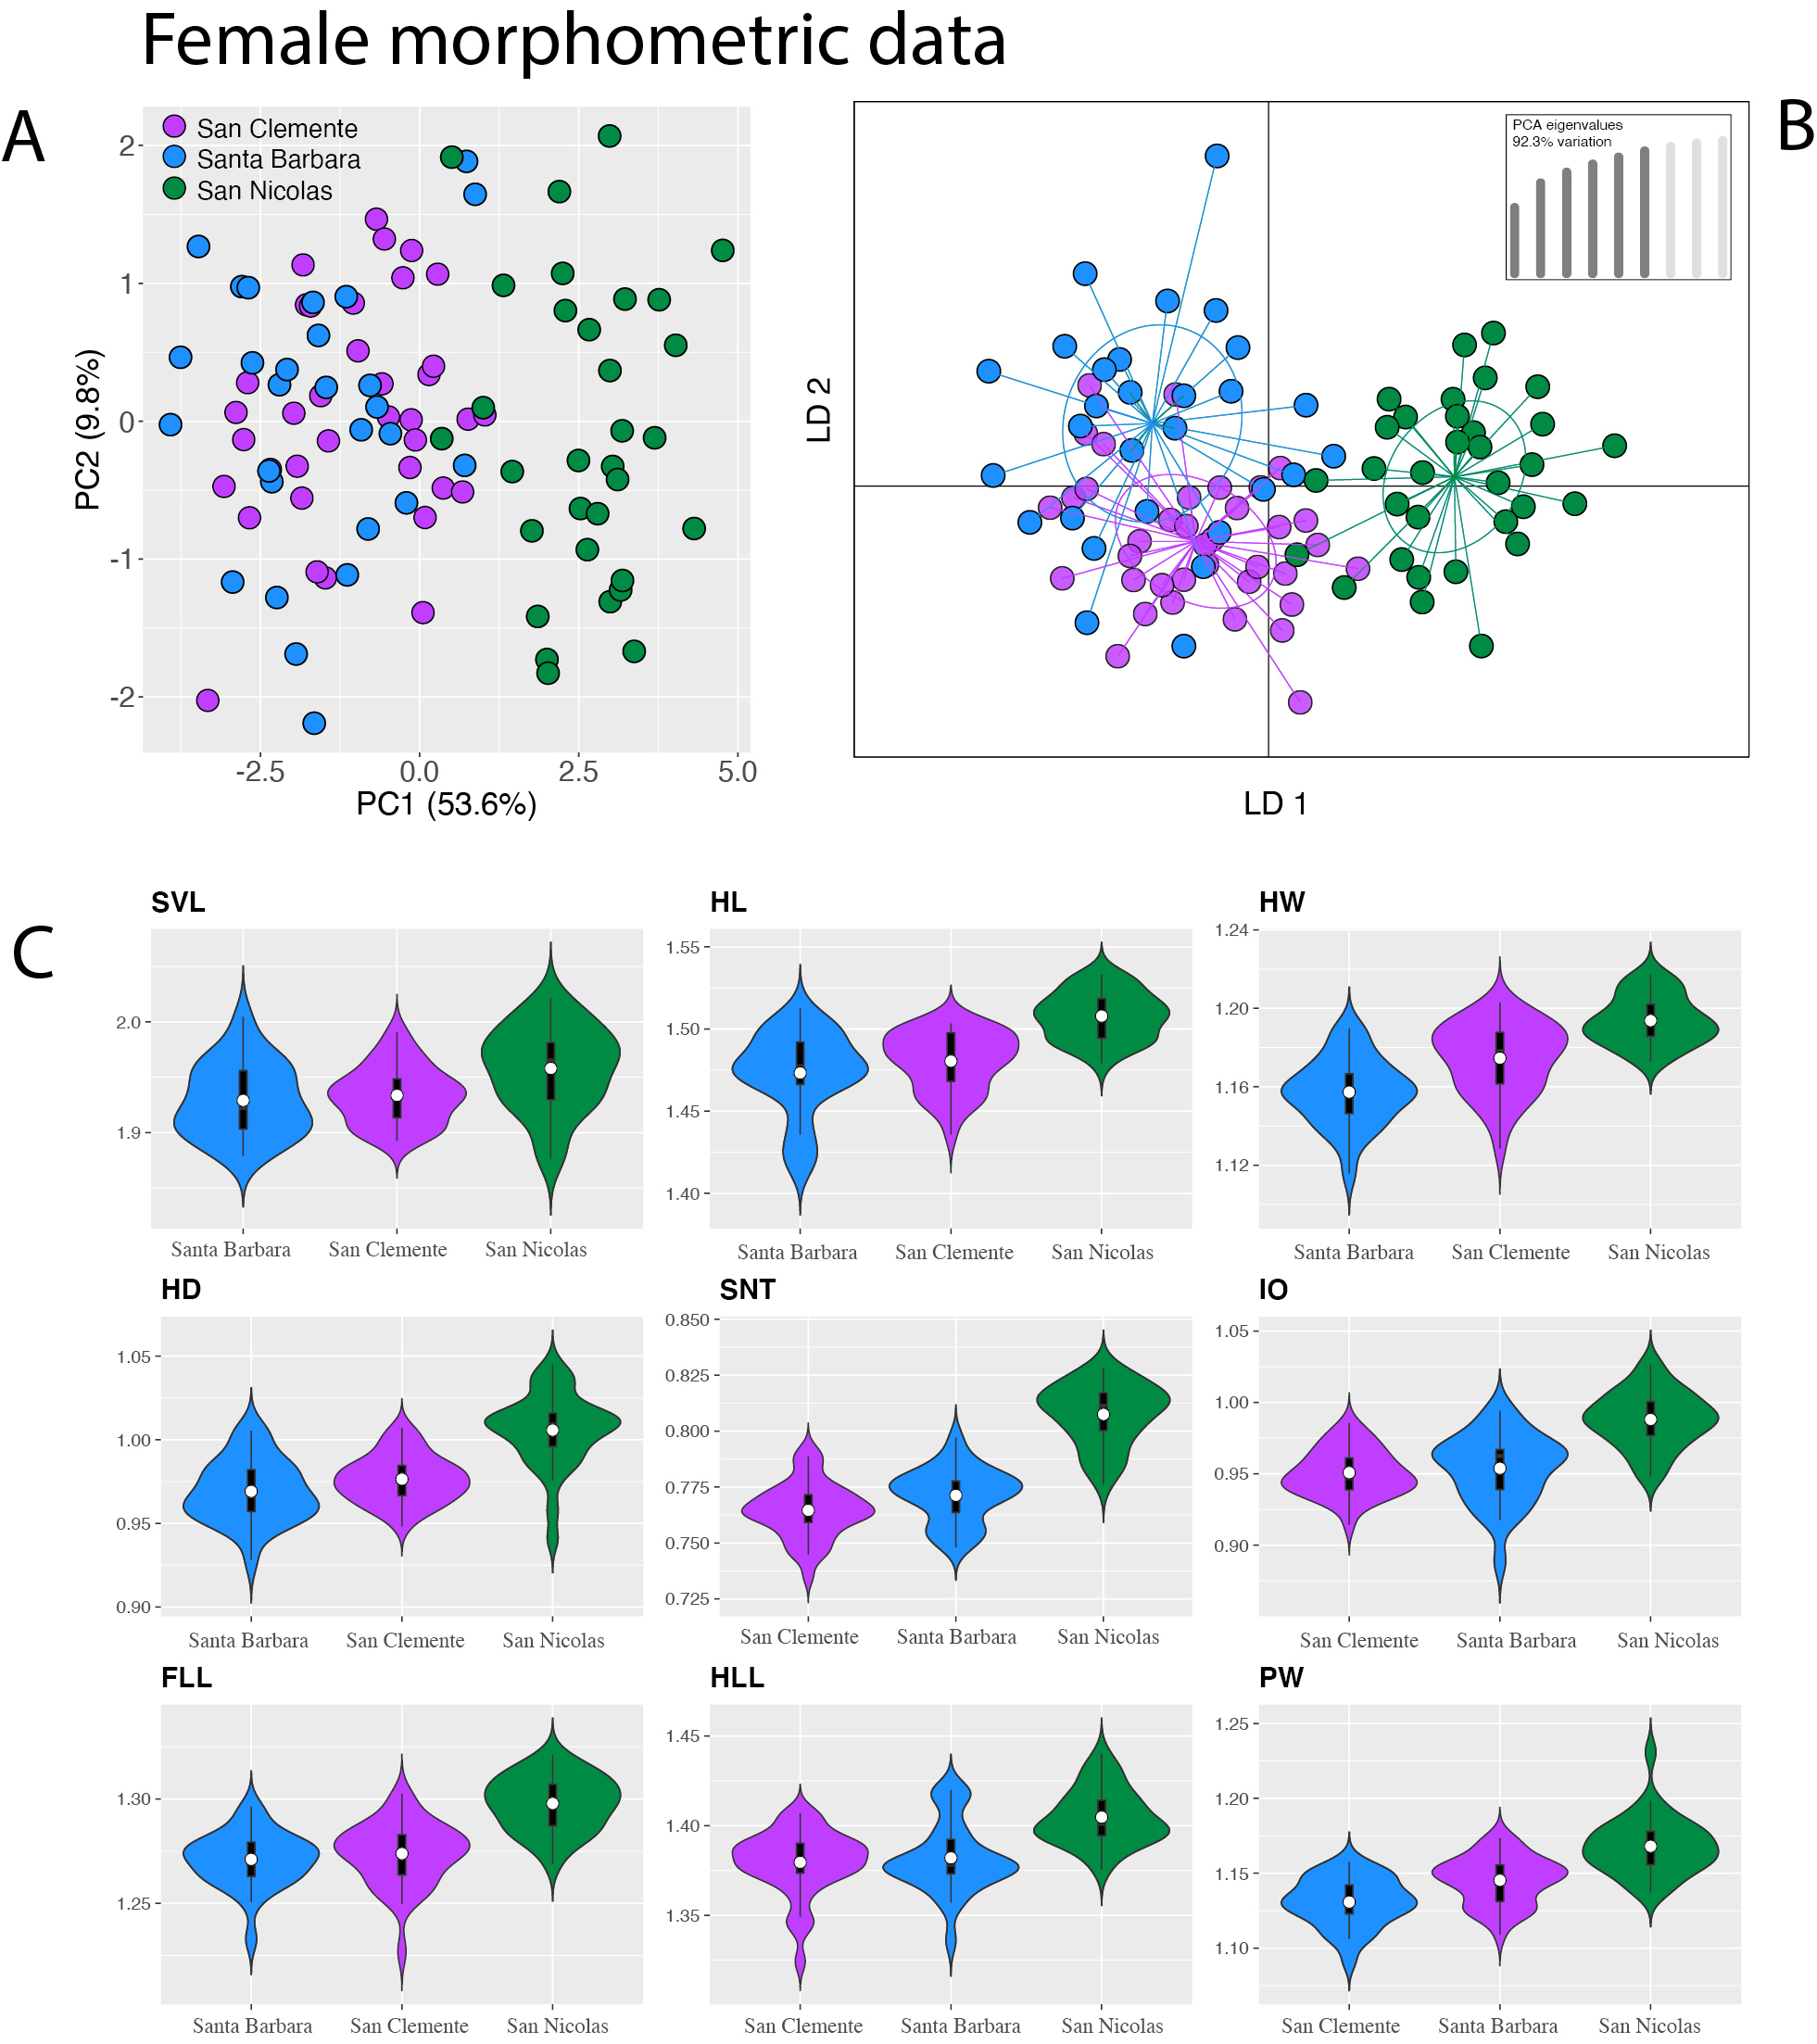
(A) Principal component analysis, (B) discriminant analyses of principal components, and (C) comparative violin plots with embedded boxplots of morphometric characters among females from each island showing the range, frequency, mean (white dot), and 50% quartile (black rectangle) for each character. Violin plots are vertically oriented mirror-imaged frequency diagrams. |