|
||
|
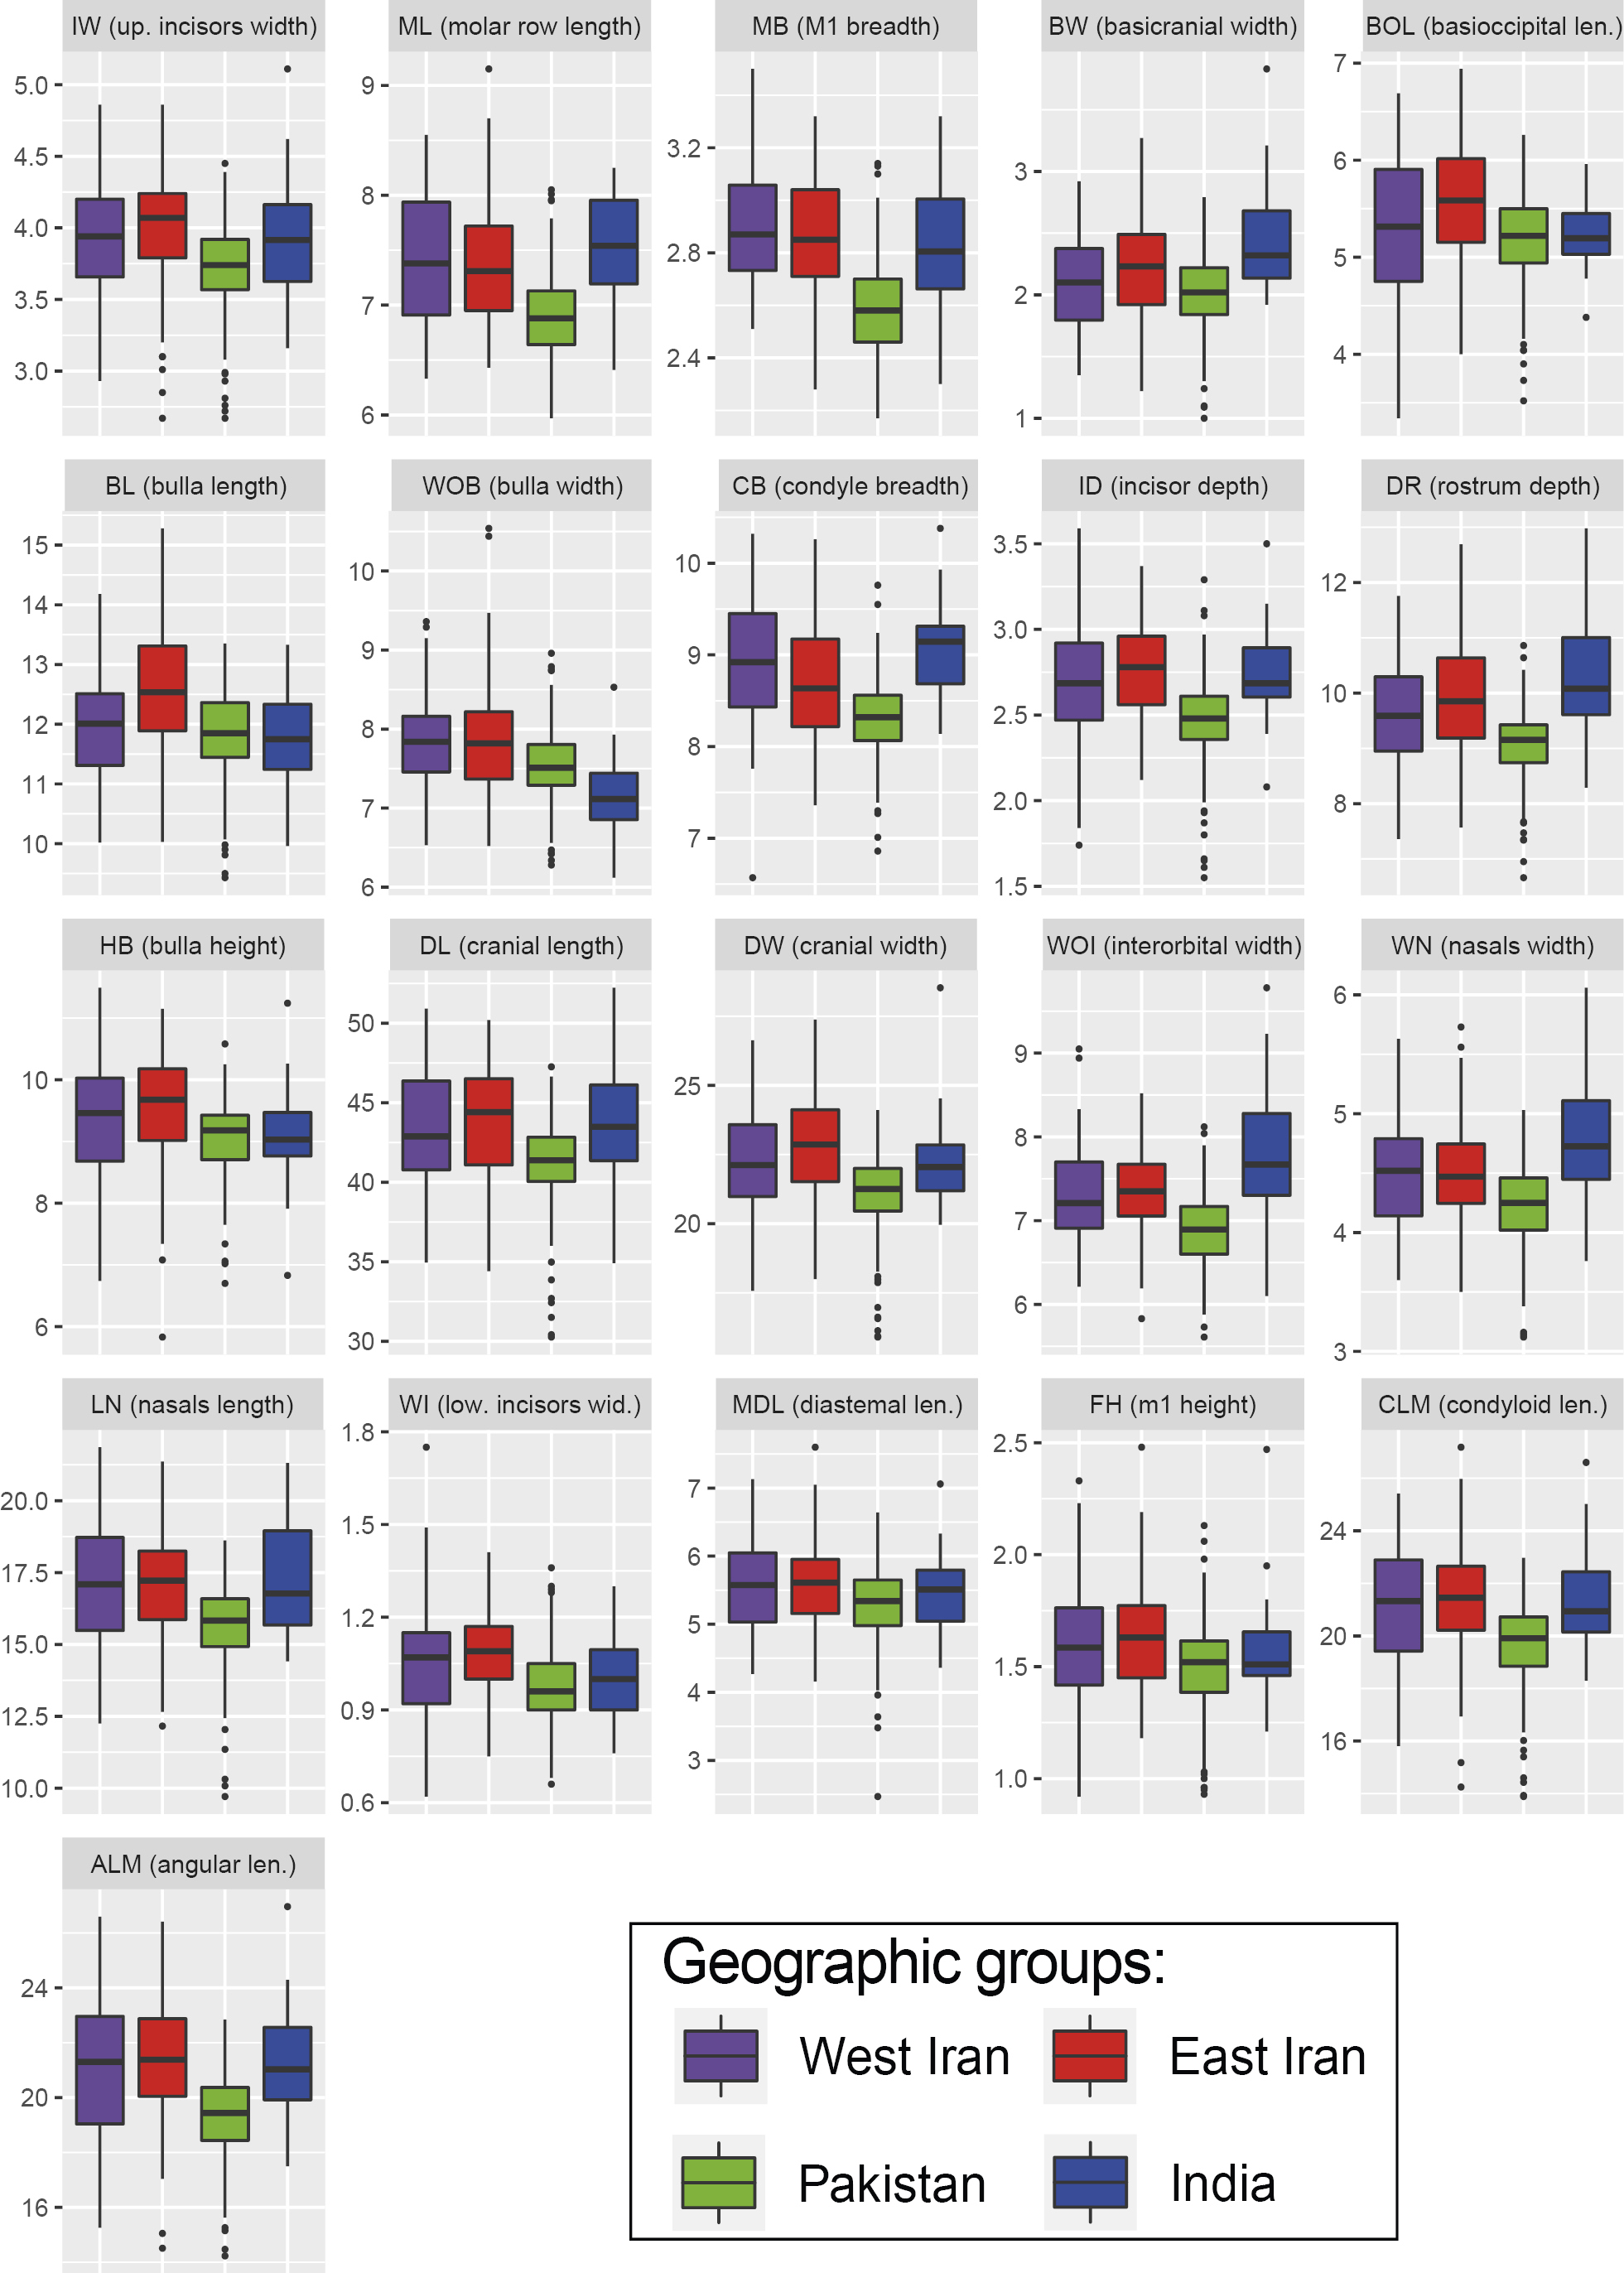
Boxplots of the 21 measurements, separated by geographic group. Inner box lines are medians (50% quantile), the lower and upper hinges are the 25th and 75th quantiles, the upper and lower points of the whiskers represent the minimum and maximum, and the outer points are outliers. Values appear in Table 1. Measurement acronyms are described in Table S1. All values are untransformed. The plot was generated using ggplot2. |