|
||
|
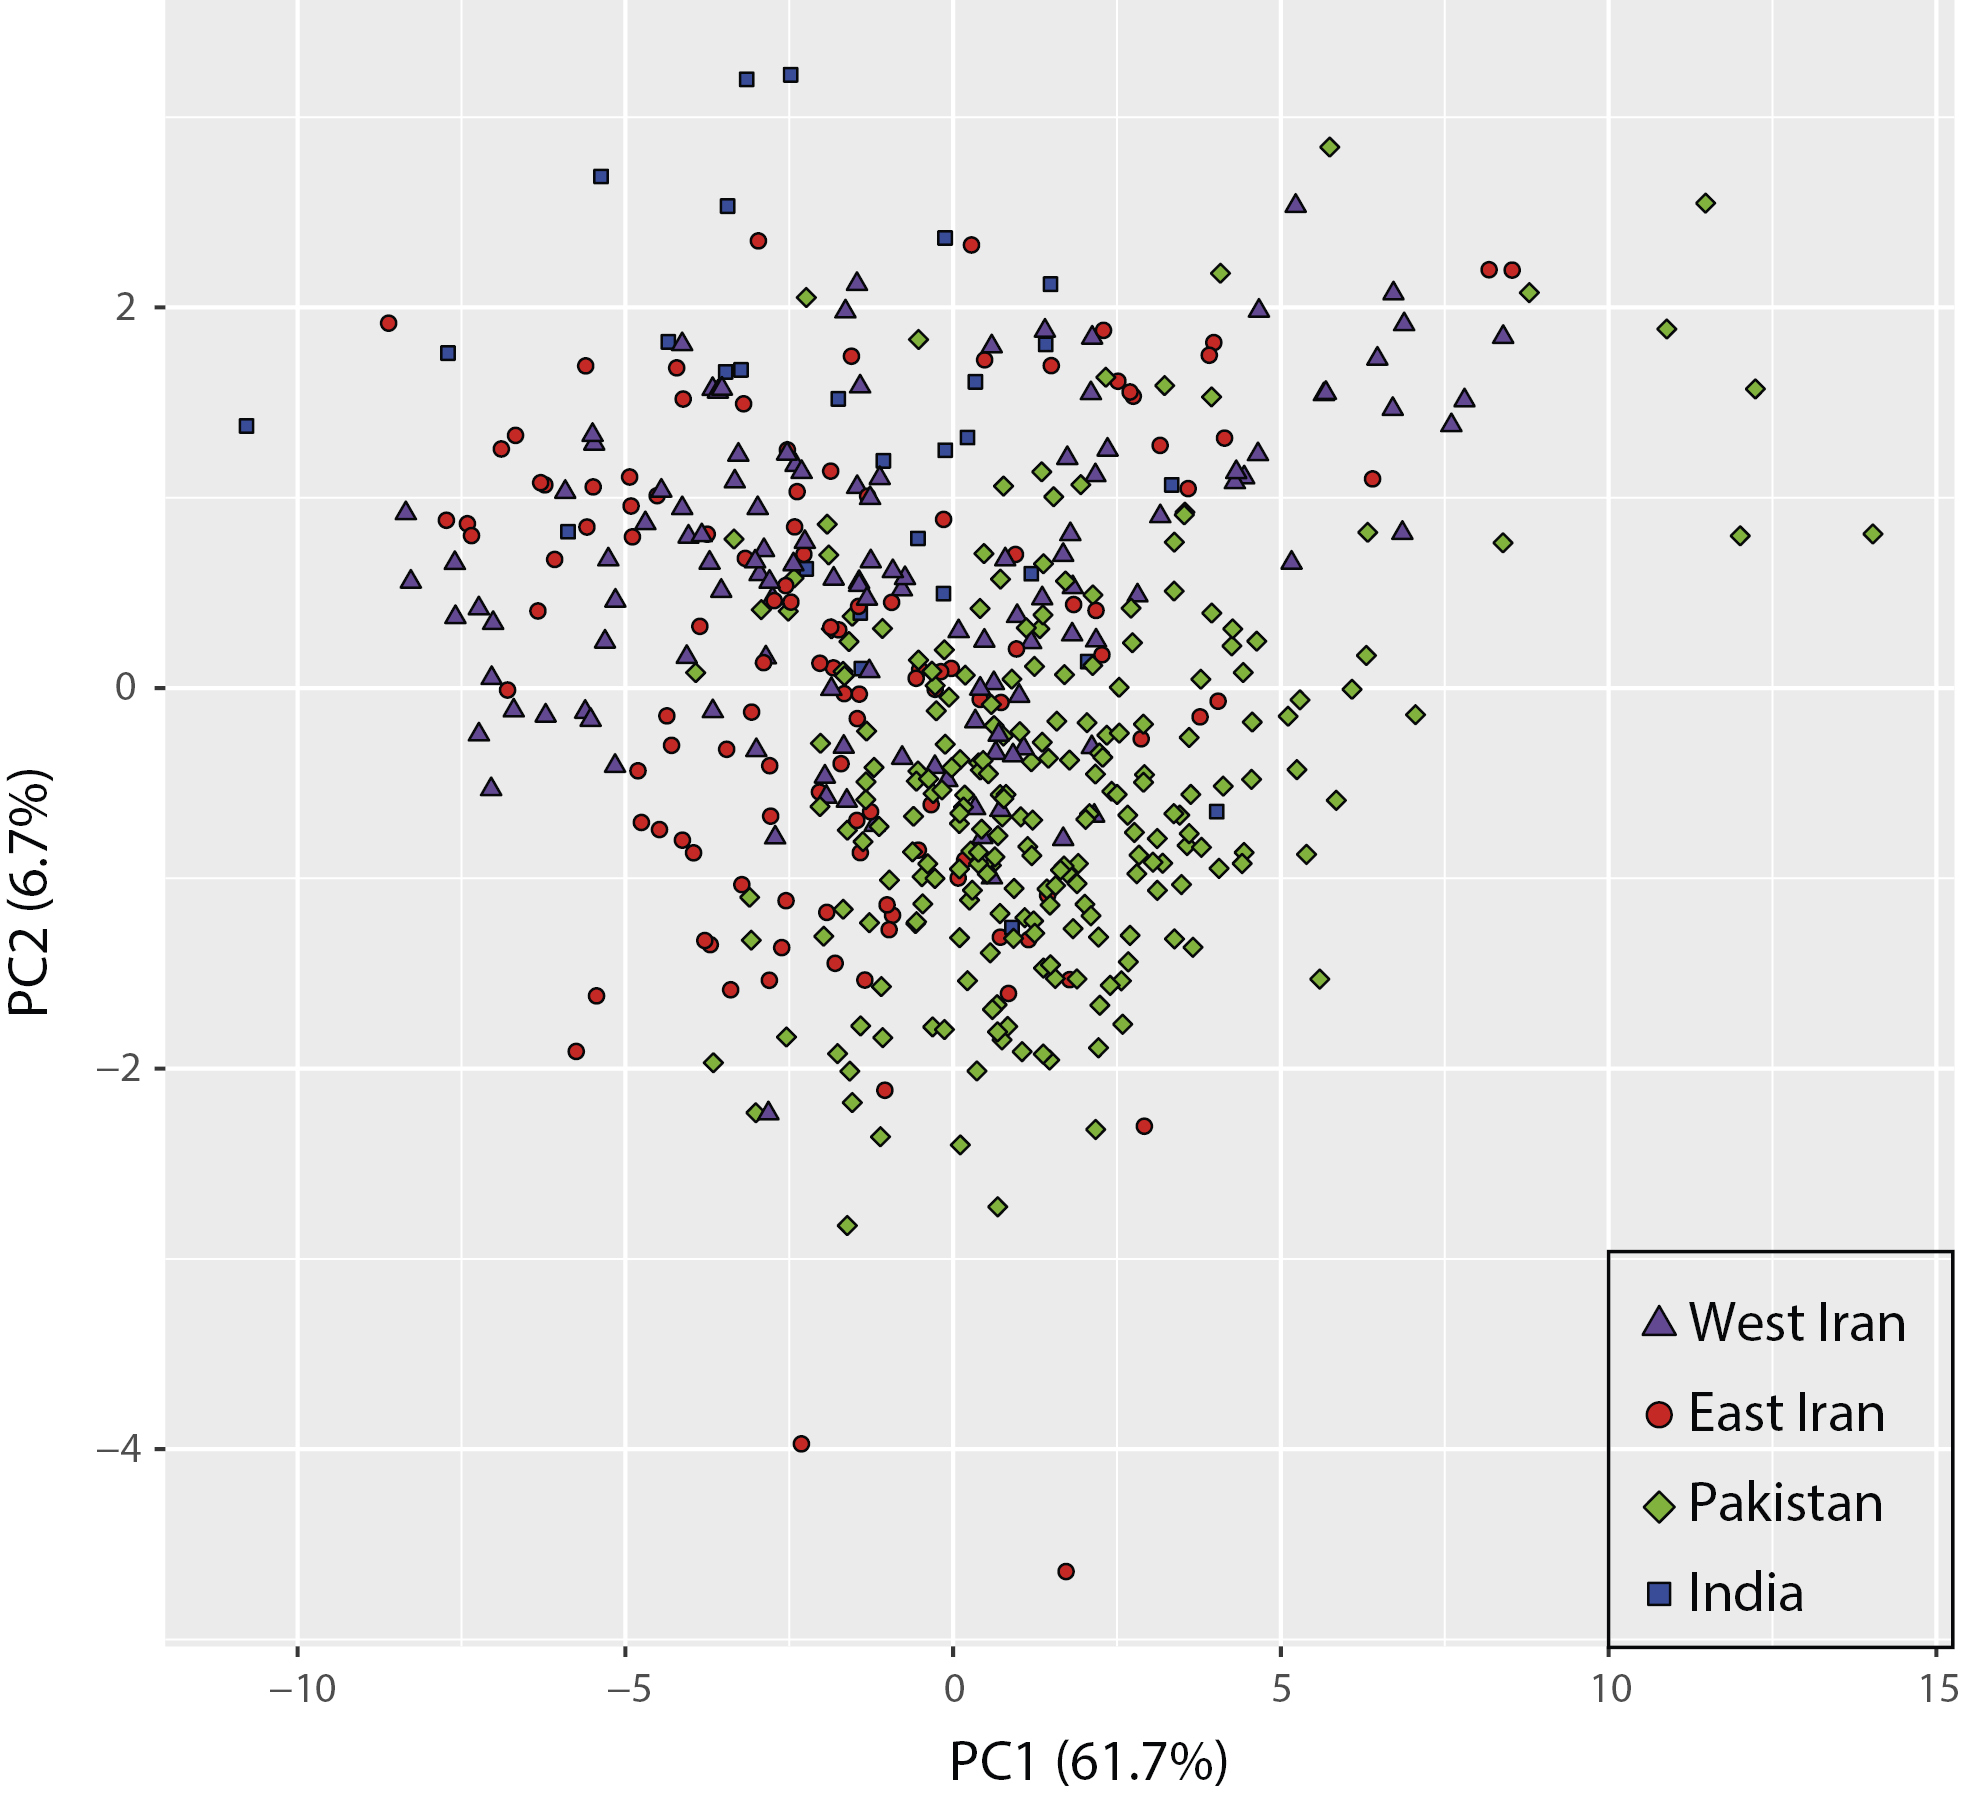
Scatterplot of the first two principal components of PCA conducted on the 21 logged measurements. Specimens are divided into the four geographic groups (see legend). The amount of explained variance by each PC axis is indicated in parentheses. The plot was generated using ggplot2. |