|
||
|
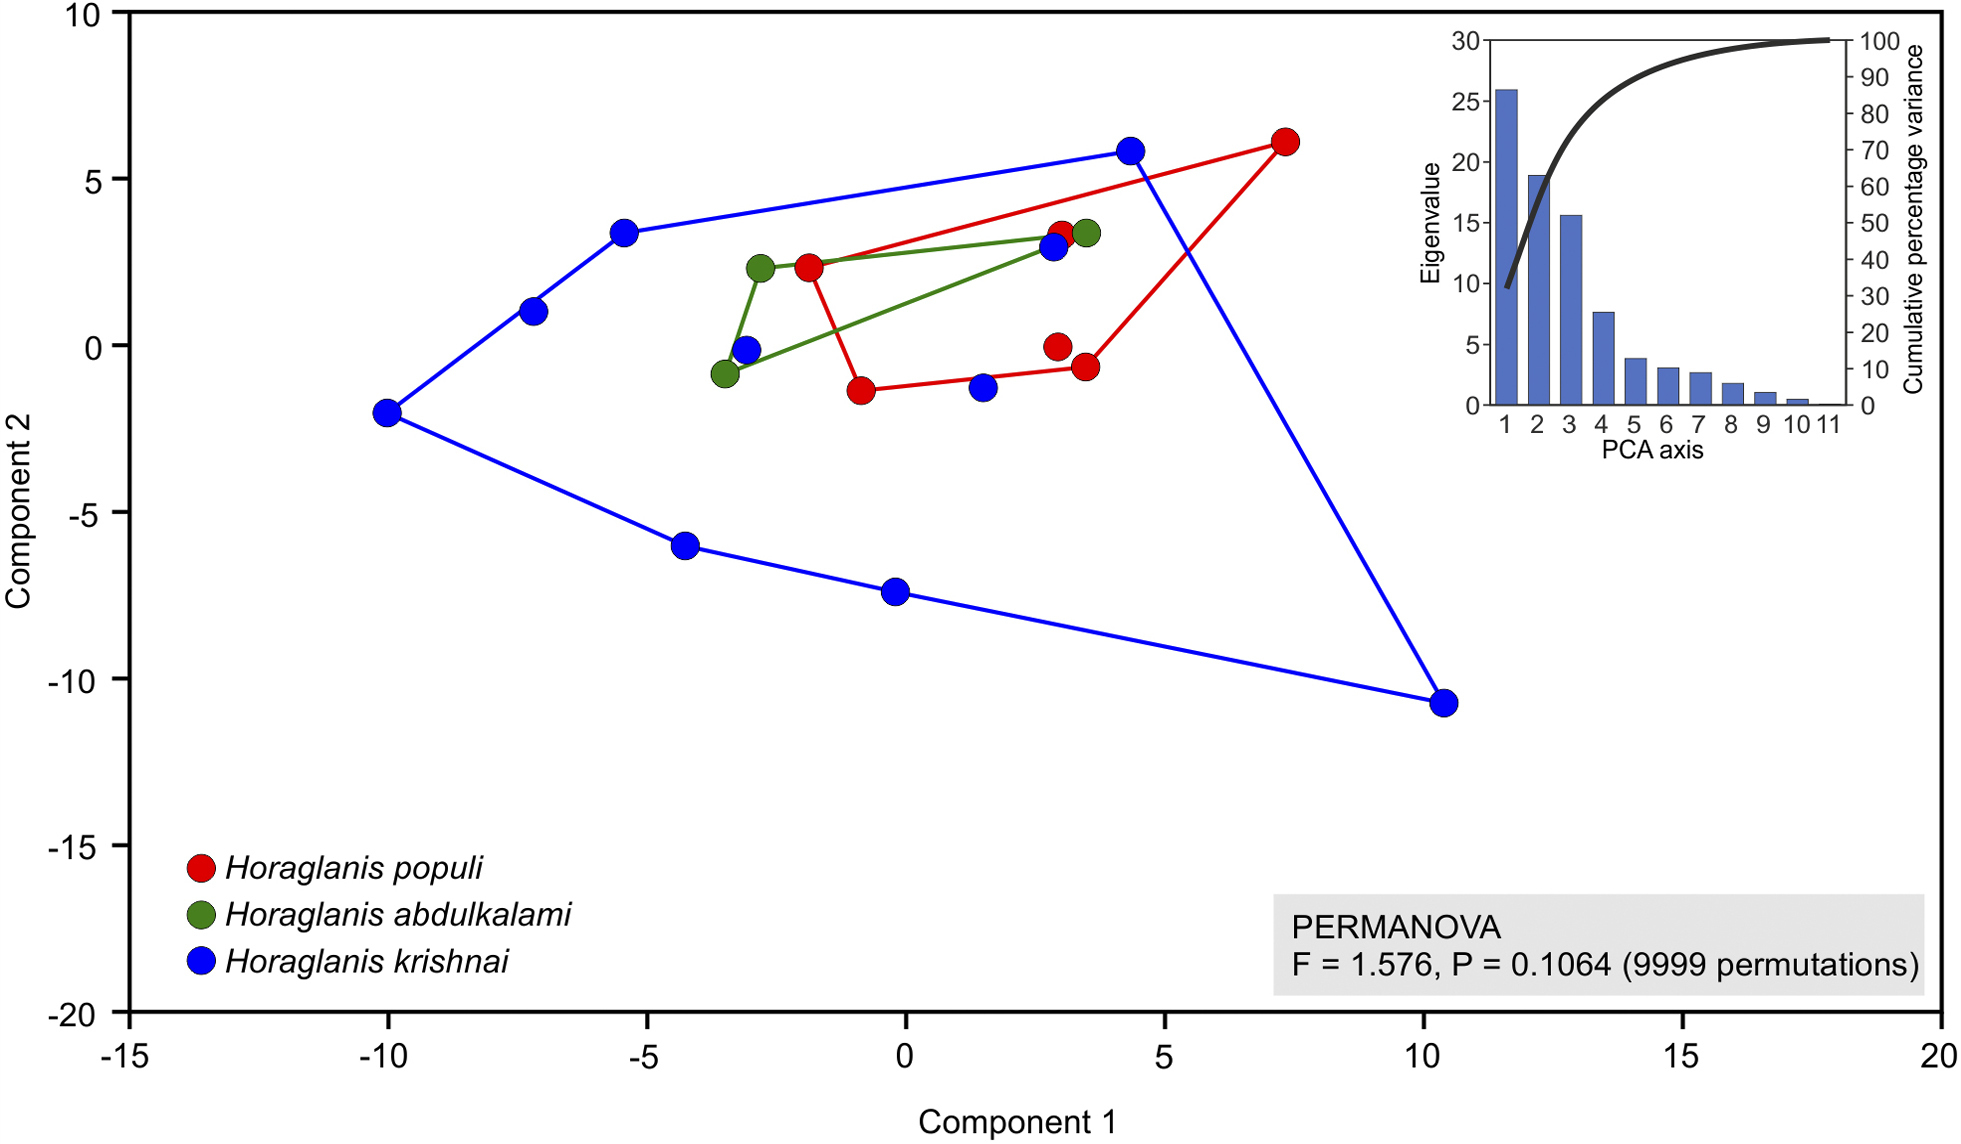
Principal Component Analysis of multivariate morphometric data presented in Table 4. Factor scores of observations are plotted on the first two components that together explained 55.28% of the total variation in the data. Scree plot for factor loadings is provided in the inset. There were no significant morphometric differences in the three species (PERMANOVA, 9999 permutations, F = 1.576, P = 0.1064). |